
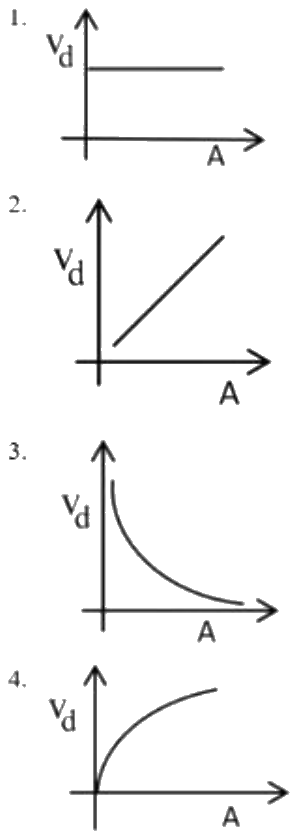
A steady current ‘I’ flows through a metallic conductor whose area of cross-section ‘A’ increases continuously from one end to the other. The variation of drift velocity of free electrons \( v_{d} \) as a function of \( A \) is represented by which of the figures given in options?
Answer & explanation
Correct answer: option 3
The correct answer is Option (3) → 3
In steady flow the same current I passes every cross-section, and \( I = neAv_d \) with n fixed for the metal.
\( \displaystyle v_d = \frac{I}{neA} \Rightarrow v_d \propto \frac{1}{A} \)
A graph of \( v_d \) against A for \( v_d \propto 1/A \) is a rectangular hyperbola: \( v_d \) is large where A is small and falls steadily, approaching the A-axis as A increases. This is figure 3.