
In the figure, AD is the aggregate demand line of an economy with lump-sum taxes, and the marginal propensity to consume is 0.75. The government raises transfer payments by 20, and aggregate demand shifts up to AD′.
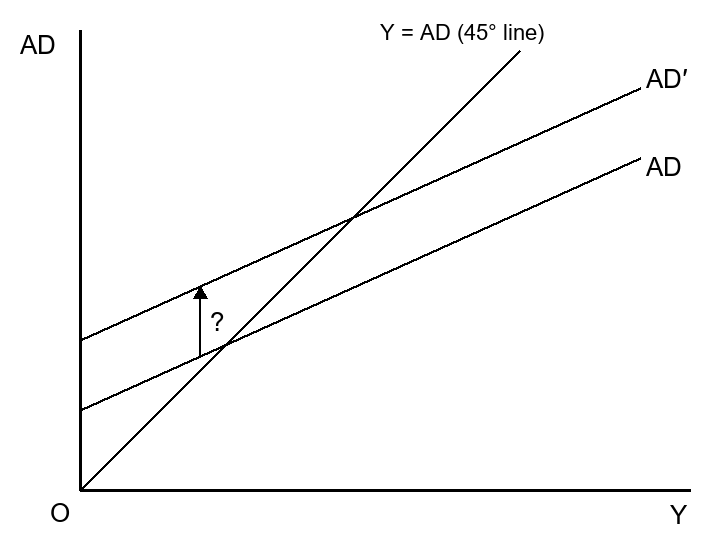
What is the vertical distance between AD and AD′?
Answer & explanation
Correct answer: option 3
The correct answer is Option (3) → 15
Given:
MPC, c = 0.75
Rise in transfers, ΔTR = 20
A transfer raises disposable income, but households spend only the fraction c of it. So autonomous spending, and the AD line, rise by c × ΔTR.
Shift of AD = 0.75 × 20 = 15
The vertical gap between the two AD lines is only the first-round rise in spending.
Option (1) 60 — this is the final rise in equilibrium income (15 × 4), not the shift of AD.
NCERT (2026-27): “Box 5.1: Fiscal Policy … Transfers: We suppose that instead of raising government spending in goods and services, government increases transfer payments, TR …” “Autonomous spending, A , will increase by cΔTR …” “… so output will rise by less than the amount by which it increases when government expenditure increases because a part of any increase in transfer payments is saved. …” |