CUET Preparation Today
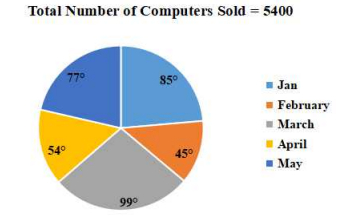
Study the given pie chart and answer the question that follows. The pie chart shows the distribution (degree-wise) of the number of computers sold by a shopkeeper during five months.
In which month was the number of computers sold above 25% of the total number of computers sold in 5 months? |
March May February January |
March |
Solving one by one for each option . 1. March Percentage of computers sold in March = \(\frac{99 }{360}\) × 100 = 27.5% 2.May Percentage of computers sold in May = \(\frac{77 }{360}\) × 100 = 21.39% 3. February Percentage of computers sold in Februaary = \(\frac{45 }{360}\) × 100 = 12.5% 4. January Percentage of computers sold in January= \(\frac{85 }{360}\) × 100 = 23.61% So , In March percentage of computers sold is more than 25%. Ans :- March |