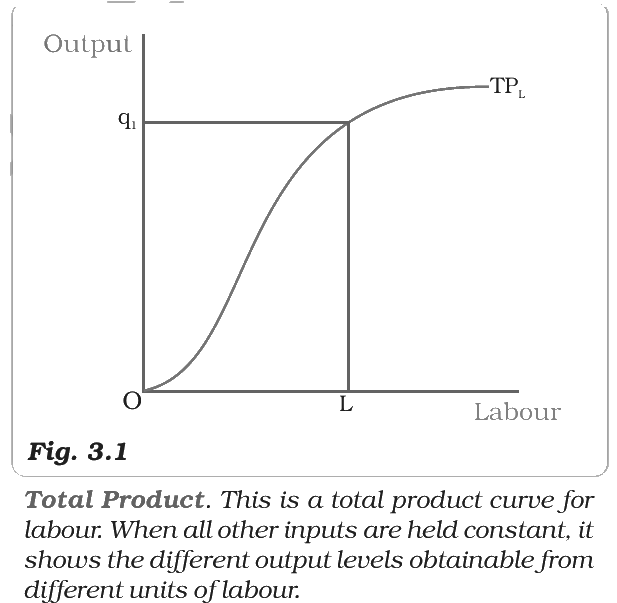
The following figure shows the shape of which curve in the input-output plane?
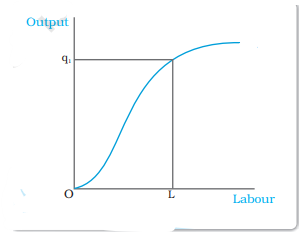
Answer & explanation
Correct answer: option 1
The correct answer is Option (1) → Total product
The curve starts at the origin and keeps rising as labour rises: slowly at first, then faster, then slowly again. This is the total product curve; it is positively sloped.
Option (1) Total product — Correct. More labour, with other inputs fixed, always gives more output.
Option (2) Marginal product — Incorrect. The MP curve is inverse ‘U’-shaped: it rises and then falls.
Option (3) Average Product — Incorrect. The AP curve is also inverse ‘U’-shaped.
Option (4) PPF — Incorrect. A PPF shows combinations of two goods, and it slopes downward.
NCERT (2026-27): “3.5 Shapes of Total Product, Marginal Product and Average Product Curves An increase in the amount of one of the inputs keeping all other inputs constant results in an increase in output. Table 3.2 shows how the total product changes as the amount of labour increases. The total product curve in the input-output plane is a positively sloped curve. Figure 3.1 shows the shape of the total product curve for a typical firm. …”
|