
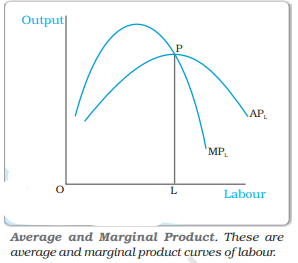
Study the figure given below and find out which statement is incorrect.
Answer & explanation
Correct answer: option 4
The correct answer is Option (4) → As long as the AP increases, it must be the case that AP is greater than MP.
An average rises only when the new addition is above the average. So while AP rises, MP must be greater than AP.
Option (1) As long as the AP increases, it must be the case that MP is greater than AP. — True. If MP were below AP, AP could not rise.
Option (2) When AP falls, MP has to be less than AP. — True. An addition below the average pulls the average down.
Option (3) To the left of L, AP is rising and MP is greater than AP. — True. L is the highest point of AP. To its left AP is rising, so MP is above it.
Option (4) As long as the AP increases, it must be the case that AP is greater than MP. — False. This reverses the rule. While AP increases, MP is greater than AP, not smaller.
NCERT (2026-27): “3.5 Shapes of Total Product, Marginal Product and Average Product Curves … As long as the AP increases, it must be the case that MP is greater than AP. Otherwise, AP cannot rise. Similarly, when AP falls, MP has to be less than AP. It, follows that MP curve cuts AP curve from above at its maximum.” “3.5 Shapes of Total Product, Marginal Product and Average Product Curves … Figure 3.2 shows the shapes of AP and MP curves for a typical firm. The AP of factor 1 is maximum at L. To the left of L, AP is rising and MP is greater than AP. To the right of L, AP is falling and MP is less than AP.” |