CUET Preparation Today
Study the graph and answer the question.
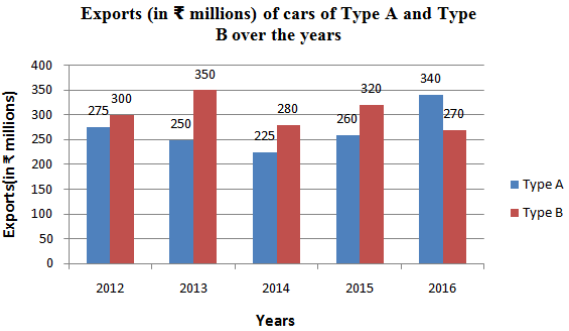
In how many years were the exports of type B cars more than the average exports of type A cars during 2012 to 2016? |
2 3 1 4 |
4 |
Average export of car of type A = \(\frac{275 + 250 + 225 + 260 + 340}{5}\) = \(\frac{ 1350}{5}\) = 270 In year 2012 , 2013 & 2014 export of car B is more than 270. Ans :- 4 |