
Identify the graph from the following showing the temperature dependence of resistivity for a typical semiconductor?
Answer & explanation
Correct answer: option 3
The correct answer is Option (3)
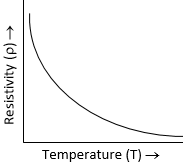
The Resistivity $(ρ)$ is,
$ρ∝\frac{1}{T}$
∴ → At low temperature, resistivity is high.
→ As the temperature increase, resistivity decreases