
The bar graph shows the exports of jeeps of type A (plain bars) and type B (hatched bars), in Rs million, from 2015 to 2019.
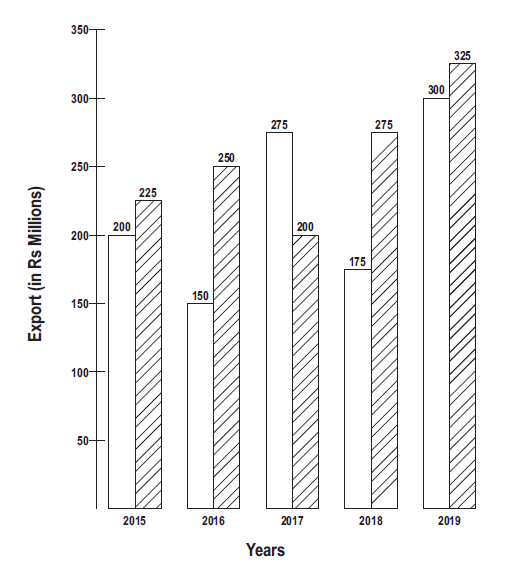
What is the difference (in Rs million) between the export of type B jeeps in 2018 and the average yearly export of type A jeeps over the five years?
Answer & explanation
Correct answer: option 1
The correct answer is Option (1) → 55
The average of type A is the sum of its five plain bars divided by 5; it is then compared with the single hatched bar of 2018.
Type B in 2018 \(=275\)
Type A, 2015 to 2019: \(200+150+275+175+300=1100\)
Average of type A \(\displaystyle =\frac{1100}{5}=220\)
Difference \(=275-220=55\)