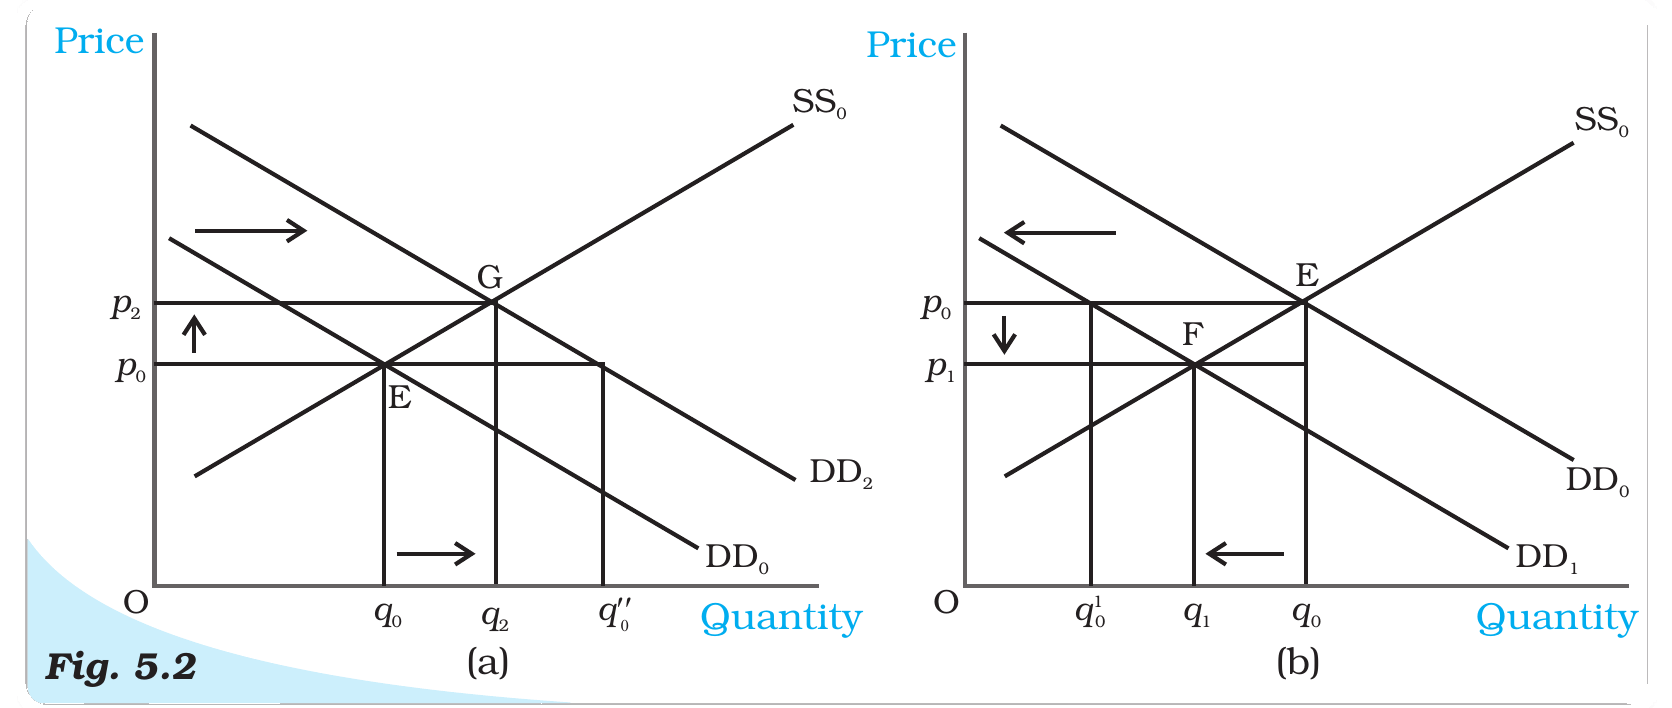
Suppose, there is an increase in the income of the consumers, that shifts the demand curve to the right. What will be the change in the equilibrium condition?
Answer & explanation
Correct answer: option 1
The correct answer is Option (1) → New equilibrium will be attained at a higher price and a higher quantity.
The price and the quantity of a good settle at the market equilibrium, where the demand curve meets the supply curve and the quantity buyers want equals the quantity sellers offer. A rightward shift of the demand curve means that buyers want more at every price; for a normal good this happens when consumers’ income rises. Supply does not change.
The market then moves to its new equilibrium in steps:
At the old price, quantity demanded now exceeds quantity supplied: there is excess demand.
Some buyers are willing to pay more, so the price rises.
As the price rises, sellers offer more along the unchanged supply curve, until quantity demanded and quantity supplied are equal again.
The new equilibrium therefore has both a higher price and a higher quantity.
Why the other options are incorrect
Option (2) Excess supply at the initial point of equilibrium. — Incorrect. Excess supply would mean sellers offering more than buyers want. Here demand has risen while supply has not, so at the old price the gap is the other way round: there is excess demand.
Option (3) New equilibrium will be attained at a higher price and a lower quantity. — Incorrect. A higher price with a lower quantity is the result of a leftward shift of supply, not of a rise in demand.
Option (4) New equilibrium will be attained at a lower price and a lower quantity. — Incorrect. Both fall only when demand shifts to the left, as with a fall in income.
NCERT (2025-26): “Demand Shift … Here we consider the example of a normal good like clothes, the demand for which increases with increase in income of consumers, thereby causing a rightward shift in the demand curve. However, this income increase does not have any impact on the supply curve, which shifts only due to some changes in the factors relating to technology or cost of production of the firms. Thus, the supply curve remains unchanged. In the Figure 5.2 (a), this is shown by a shift in the demand curve from DD0 to DD2 but the supply curve remains unchanged at SS0. From the figure, it is clear that at the new equilibrium, the price of clothes is higher and the quantity demanded and sold is also higher.…”
|