CUET Preparation Today
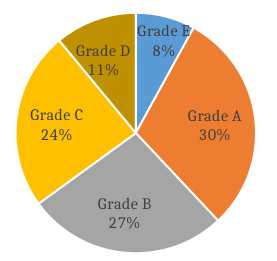
Performance of 1800 students in grades has been shown in the following pie chart. How many students have got either grade D or grade E ?
|
345 352 342 359 |
342 |
Number of students got either grade D or grade E= \(\frac{11 + 8}{100}\) × 1800 = \(\frac{19}{100}\) × 1800 = 342 |