CUET Preparation Today
CUET
Physics
Current Electricity
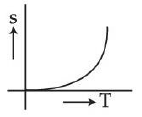
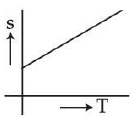
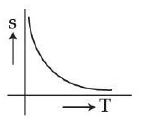
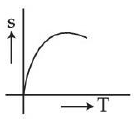
Which of the following graph correctly represents the variation of resistivity 's' with temperature 'T' for a semiconductor material?
The correct answer is Option (3)
Graph characteristics: