CUET Preparation Today
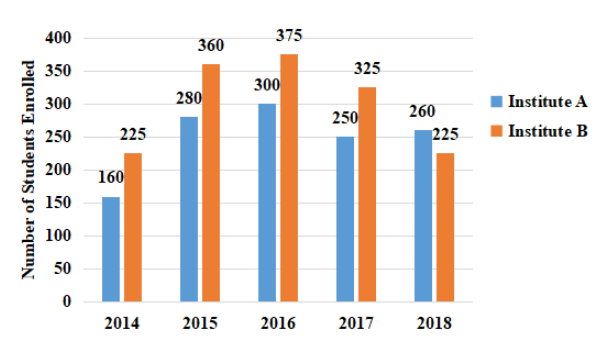
The bar graph shows the number of students enrolled for a science course in institutes A and B during 5 years from 2014 to 2018.
What is the ratio of the total numbers of students enrolled in institute B in 2015 and 2017 to that of students enrolled in institute A in 2014 and 2016? |
111 : 91 91 : 111 92 : 137 137 : 92 |
137 : 92 |
Students in B in 2015 & 2017 = 360 + 325 = 685 Students in A in 2014 & 2016 = 160 + 300 = 460 Required ratio , 685 : 460 = 137 : 92 |