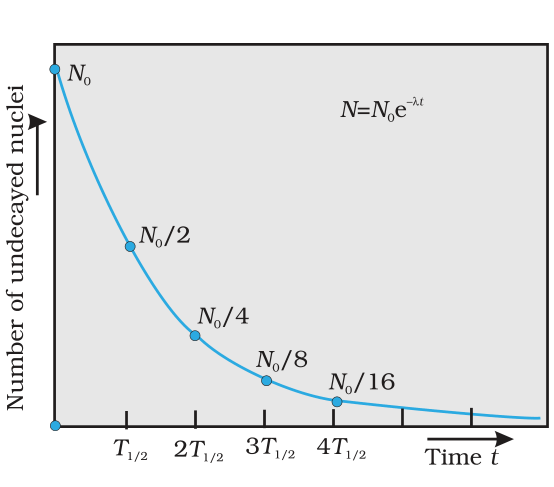
The variation of number of undecayed nuclei with time is best represented by (Where \( N_0 \)-initial number of atoms)
Answer & explanation
Correct answer: option 2
The correct answer is Option (2)
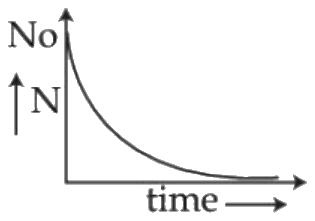
By the law of radioactive decay, the rate of decay is proportional to the number of undecayed nuclei, which gives an exponential decay:
\( \displaystyle N = N_0\,e^{-\lambda t} \)
So the graph starts at \( N_0 \) at \( t = 0 \), falls steeply at first and then more and more slowly, approaching zero but never reaching it. Graph (B) has exactly this shape.
Why the other options are incorrect
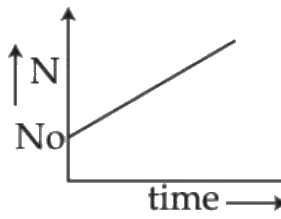
Option (1) — Incorrect. Here \( N \) increases with time, but undecayed nuclei can only decrease.
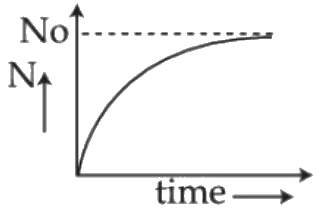
Option (3) — Incorrect. This curve starts at zero and grows towards \( N_0 \); that is the shape of the number of nuclei that have decayed, \( N_0(1 - e^{-\lambda t}) \).
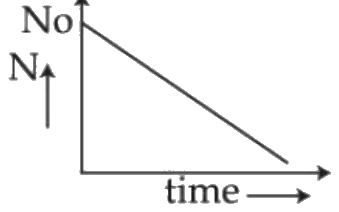
Option (4) — Incorrect. A straight line would mean a constant decay rate, but the rate falls as \( N \) falls, so the graph must curve.
Note: This question is from the pre-rationalised NCERT book (2022-23). The topic was removed from the latest NCERT book (2026-27), and it also appears to be out of the CUET 2026 syllabus.
NCERT (Pre-rationalised edition, 2022-23):
Law of Radioactive Decay – “… Setting t0 = 0 and rearranging Eq. (13.12) gives us
\( \displaystyle \ln\frac{N}{N_0} = -\lambda t \qquad (13.13) \)
which gives
\( \displaystyle N(t) = N_0\, e^{-\lambda t} \qquad (13.14) \)”
Law of Radioactive Decay – “… The decay of radionuclides follows quite a different law, the law of radioactive decay represented by Eq. (13.14).”