
CUETMOCK
  • Pricing
  • Mentors
Log inStart freeStart free mocks→

First test, then trust

Try a free CUET mock test.

Join 5,00,000+ students who rehearsed exam day on the exact NTA screen before sitting CUET. On the web and on Android.

Start free mocks →Get the Android app
CUETMOCK

India's #1 CUET Mock Test Platform. Original NCERT-based questions on the exact NTA exam screen — trusted by 5,00,000+ students since CUET 2022.

Get it onGoogle PlayScan to download the CUETMOCK app

Mock tests

  • CUET mock test series
  • Browse all papers
  • Commerce mocks
  • Humanities (Arts) mocks
  • Science mocks
  • Languages & GAT mocks
  • Free practice questions
  • Pricing

Resources

  • CUET exam guide
  • CUET syllabus
  • Universities accepting CUET
  • Expert blogs
  • News & notifications
  • Webinars & counselling
  • CUET score calculator
  • How we estimate your rank
  • FAQs

Company

  • About us
  • Our leadership & team
  • Our toppers
  • Mentors
  • For schools
  • Contact us
  • Terms
  • Privacy
  • Refund policy

Talk to us

+91 7696 6630 56info@cuetmock.comWhatsApp us

Our other platforms

  • JEE Mock — For IIT-JEE aspirants
  • NEET Mock — For NEET aspirants

Newsletter

Exam updates, study material and offers — no spam.

© 2026 NYC Ventures Pvt. Ltd.

701-702, Royal Business Park, Zirakpur, Punjab - 140603

  • Terms of use
  • Privacy policy
  • Refund policy
  • Contact us

iCUETMOCK is an independent preparation platform, not affiliated with the National Testing Agency (NTA). Always check exam details on the official NTA website.

  • Home
  • Mock tests
  • CUET guide
  • Pricing
  • Log in
Home/Practice questions/General Aptitude Test
General Aptitude TestQuantitative ReasoningData Interpretation & Stats

The following bar chart represents the birth rate (per thousands) of…

The following bar chart represents the birth rate (per thousands) of six different countries. Study the bar chart and answer the question given below.
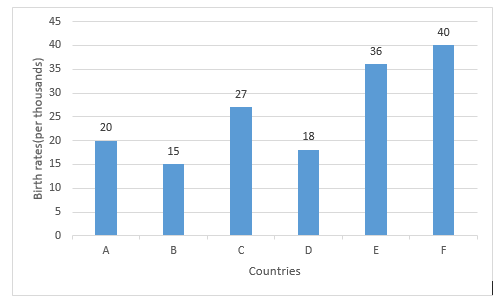
The birth rate which country is exactly 50% more than that of Country D?

Answer & explanation+

Correct answer: option 2

Birth rate of country D = 18

ATQ ,

50% more than that of company D.

= 18 + \(\frac{50 }{100 }\) × 18

= 18 + 9

= 27

By observing the bar chart carefully , we find that birth rate of country C is 27.

Ans :- Country C

Advertisement

Practise more on Quantitative Reasoning

Chapter-wise mocks on the real NTA exam screen, with solutions and your rank. Your first mocks are free.

Start free mocks →

Advertisement

Next questions

  1. Physics · Wave Optics
  2. Identify the product 'X' in the following reaction:Chemistry · Organic: Alcohols, Phenols and Ethers
  3. वर्तनी के आधार पर निम्नलिखित में से कौन-सा शब्द शुद्ध है?Hindi · व्याकरण - सशब्द शुद्धि
  4. From a point 15 m above the water level, the angle of elevation of the top of a hill is 600 and the angle of depression of the base of the…General Aptitude Test · Quantitative Reasoning
  5. Mean of the data is :General Aptitude Test · Numerical Ability
  6. In which field is the Booker Prize awarded?General Aptitude Test · General Knowledge
  7. सूची-I को सूची-II से सुमेलित कीजिए: सूची-I शब्द सूची-II विलोम (A) कुपुत्र (I) ज्येष्ठ (B) खाद्य (II) स्थूल (C) कनिष्ठ (III) सुपुत्र (D) कृश…Hindi · विलोम शब्द
  8. Which of the following pairs gives two attributes of a stable community?Biology · Biodiversity and Conservation
  9. Consider the following statements about Buchanan and his accounts of the countryside:(A) Buchanan was an employee of the British East India…History · Modern India: Colonialism and the Countryside
  10. The graphic print "Devi" is made with which technique?Fine Arts · The Modern Indian Art