CUET Preparation Today
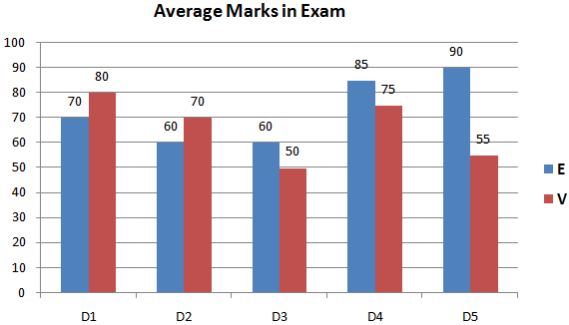
The given bar chart presents the average marks obtained in English (E) and vernacular (V) by the students of five districts (D1, D2, D3, D4, D5)in a state at the secondary level examination of a particular year (marks secured out of a total of 100).
What is the difference between the average percentage of marks in vernacular of the districts (D1, D2, D4) and (D3, D5)? |
11.3% 22.5% 3.5% 1.7% |
22.5% |