CUET Preparation Today
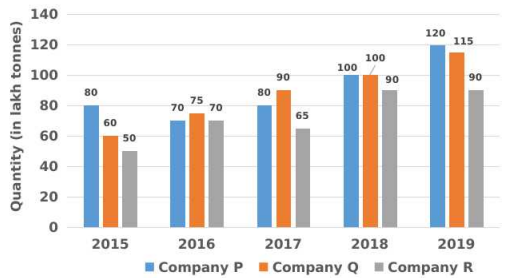
Study the given bar graph and answer the question that follows. The bar graph indicates the production of sugar (in lakh tonnes) by three different sugar companies P, Q and R over the years 2015 to 2019.
By what percentage is the total production of sugar by company P from the year 2015 to 2019 more than the total production of sugar by company R from the year 2015 to 2019? |
18% 18.5% 23.28% 15% |
23.28% |
Total production of sugar by company P from the year 2015 to 2019 = 80 + 70 + 80 + 100 + 120 = 450 Total production of sugar by company R from the year 2015 to 2019 = 50 + 70 + 65 + 90 + 90 = 365 Required percentage = \(\frac{450-365 }{365}\) × 100 = \(\frac{ 85 }{365}\) × 100 = 23.28% |