
The current flowing through an inductor of self inductance L is continuously increasing. The correct graph, showing the variation of induced emf(e) versus \( \displaystyle\frac{dI}{dt} \)?
Answer & explanation
Correct answer: option 1
The correct answer is Option (1)
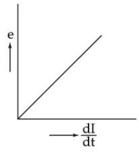
The self-induced emf of an inductor is proportional to the rate of change of current, \( e = L\,dI/dt \) in magnitude (the minus sign only says that the emf opposes the increase of current). For a given inductor L is constant, so the graph of e against \( dI/dt \) is a straight line through the origin whose slope is L: no emf when the current is steady, and an emf that grows in proportion to \( dI/dt \).
NCERT (2026-27):
Self-Inductance – “… When the current is varied, the flux linked with the coil also changes and an emf is induced in the coil. Using Eq. (6.13), the induced emf is given by
\( \displaystyle \varepsilon = -\frac{d\left(N\Phi_B\right)}{dt} = -L\frac{dI}{dt} \qquad (6.14) \)”