
CUETMOCK
  • Pricing
  • Mentors
Log inStart freeStart free mocks→

First test, then trust

Try a free CUET mock test.

Join 5,00,000+ students who rehearsed exam day on the exact NTA screen before sitting CUET. On the web and on Android.

Start free mocks →Get the Android app
CUETMOCK

India's #1 CUET Mock Test Platform. Original NCERT-based questions on the exact NTA exam screen — trusted by 5,00,000+ students since CUET 2022.

Get it onGoogle PlayScan to download the CUETMOCK app

Mock tests

  • CUET mock test series
  • Browse all papers
  • Commerce mocks
  • Humanities (Arts) mocks
  • Science mocks
  • Languages & GAT mocks
  • Free practice questions
  • Pricing

Resources

  • CUET exam guide
  • CUET syllabus
  • Universities accepting CUET
  • Expert blogs
  • News & notifications
  • Webinars & counselling
  • CUET score calculator
  • How we estimate your rank
  • FAQs

Company

  • About us
  • Our leadership & team
  • Our toppers
  • Mentors
  • For schools
  • Contact us
  • Terms
  • Privacy
  • Refund policy

Talk to us

+91 7696 6630 56info@cuetmock.comWhatsApp us

Our other platforms

  • JEE Mock — For IIT-JEE aspirants
  • NEET Mock — For NEET aspirants

Newsletter

Exam updates, study material and offers — no spam.

© 2026 NYC Ventures Pvt. Ltd.

701-702, Royal Business Park, Zirakpur, Punjab - 140603

  • Terms of use
  • Privacy policy
  • Refund policy
  • Contact us

iCUETMOCK is an independent preparation platform, not affiliated with the National Testing Agency (NTA). Always check exam details on the official NTA website.

  • Home
  • Mock tests
  • CUET guide
  • Pricing
  • Log in
Home/Practice questions/Applied Maths. Section B2
Applied Maths. Section B2Inferential Statistics

One of the following is true for relation between sample mean (x) and…

One of the following is true for relation between sample mean \((\bar{x})\) and population mean \((\mu)\).

Answer & explanation+

Correct answer: option 4

The correct answer is Option (4) → \(|\bar{x} - \mu|\) decreases when increase the size of samples

The spread of the sample mean about the population mean is measured by the standard error:

    \( \displaystyle SE(\bar{x}) = \frac{\sigma}{\sqrt{n}} \)

As the sample size n increases, \(\sqrt{n}\) increases and the standard error decreases. So the sample mean comes closer to \(\mu\): the difference \(|\bar{x} - \mu|\) decreases as the sample size increases (in the usual sense, on average over samples).

A sample mean need not equal \(\mu\) for every sample, so \(\bar{x} = \mu\) for all sample sizes is not true, and the difference neither grows nor stays fixed as n grows.

CBSE Applied Mathematics (Class XII):
Sampling Errors
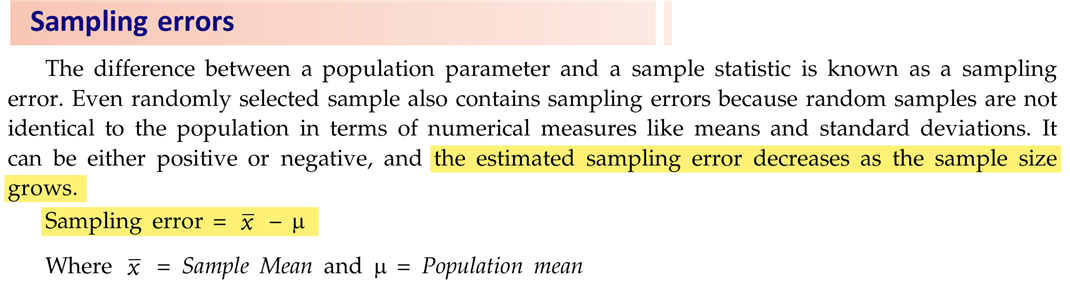
CBSE extract

Advertisement

Practise more on Inferential Statistics

Chapter-wise mocks on the real NTA exam screen, with solutions and your rank. Your first mocks are free.

Start free mocks →

Advertisement

Next questions

  1. Solution of displaystyledy/dx=(1+x^2)(1+y^2) is:Maths. Section B1 · Differential Equations
  2. Select the option in which the numbers are related in the same way as are the numbers in the given set. (12, 96, 8)General Aptitude Test · General Ability
  3. Select the most appropriate one-word substitution for the given group of words. A signature of a celebrity (signature of oneself)English · One Word
  4. The general solution of the differential equation e^x dy + (y e^x + 2x) dx = 0 isApplied Maths. Section B2 · Calculus
  5. ओंकारनाथ कैसे कदम रखते हैं?Hindi · Comprehension - (Narrative / Factual)
  6. Who is the artist of this painting?Fine Arts · The Mughal School of Miniature Painting
  7. सही वर्तनी वाला शब्द कौन-सा है?Hindi · व्याकरण - सशब्द शुद्धि
  8. Which one of the following crisis triggered the 'New Economic Reforms' of 1991?Political Science · Politics in India Since Independence: Recent Developments in Indian Politics
  9. Match the following concepts (List-I) with their appropriate description (List-II) : List-I(Concepts)List-II(Definition)(A)Fertility Rate(I…Sociology · Indian Society: Demographic Structure of Indian Society
  10. Given is the graph of potential difference (V) across combination of three identical cells in series versus current (I). The emf of each ce…Physics · Current Electricity