CUET Preparation Today
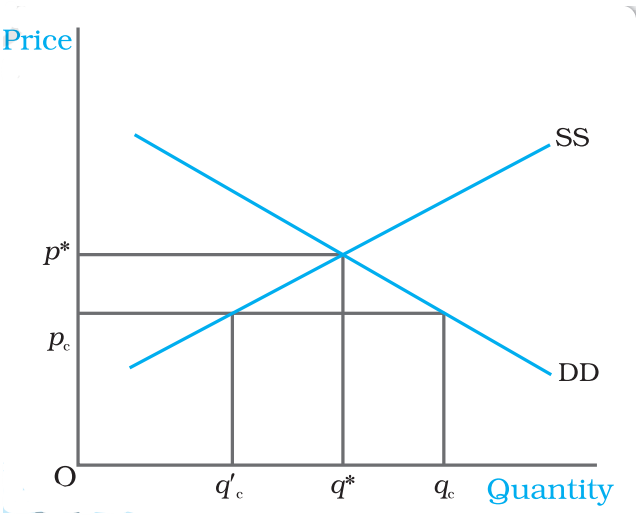
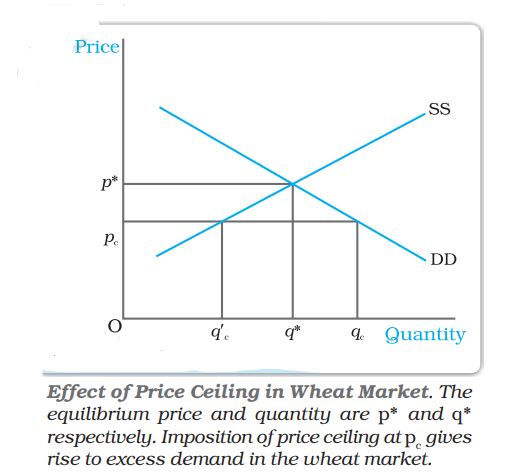
Study the below graph which shows the price ceiling set by the government. Excess demand is denoted by? |
q’c to qc q’c to q* q* to qc 0 to qc |
q’c to qc |
The correct answer is Option 1: q’c to qc At price pc, demand is qc and supply is q’c. since qc> q’c, there is excess demand measured by q’c to qc.
|