CUET Preparation Today
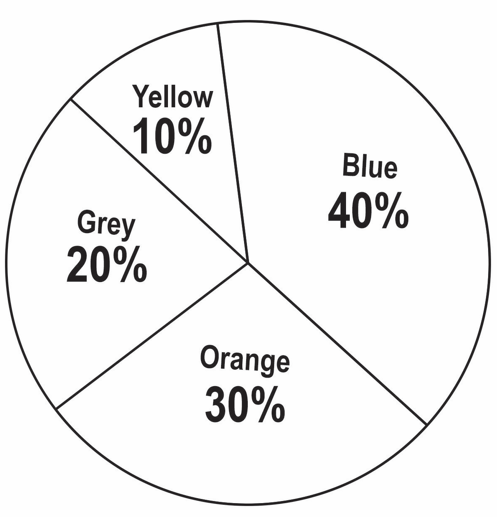
The following pie chart shows the different colored dresses worn by 120 students in a college party. Study the pie chart and answer the question that follows.
The difference between no. of students who wore Grey and yellow colored dress is? |
10 11 12 14 |
12 |
Number of students who wore grey = 120 × 20% = 24 Number of students who wore yellow = 120 × 10% = 12 Difference = 24 - 12 = 12 |