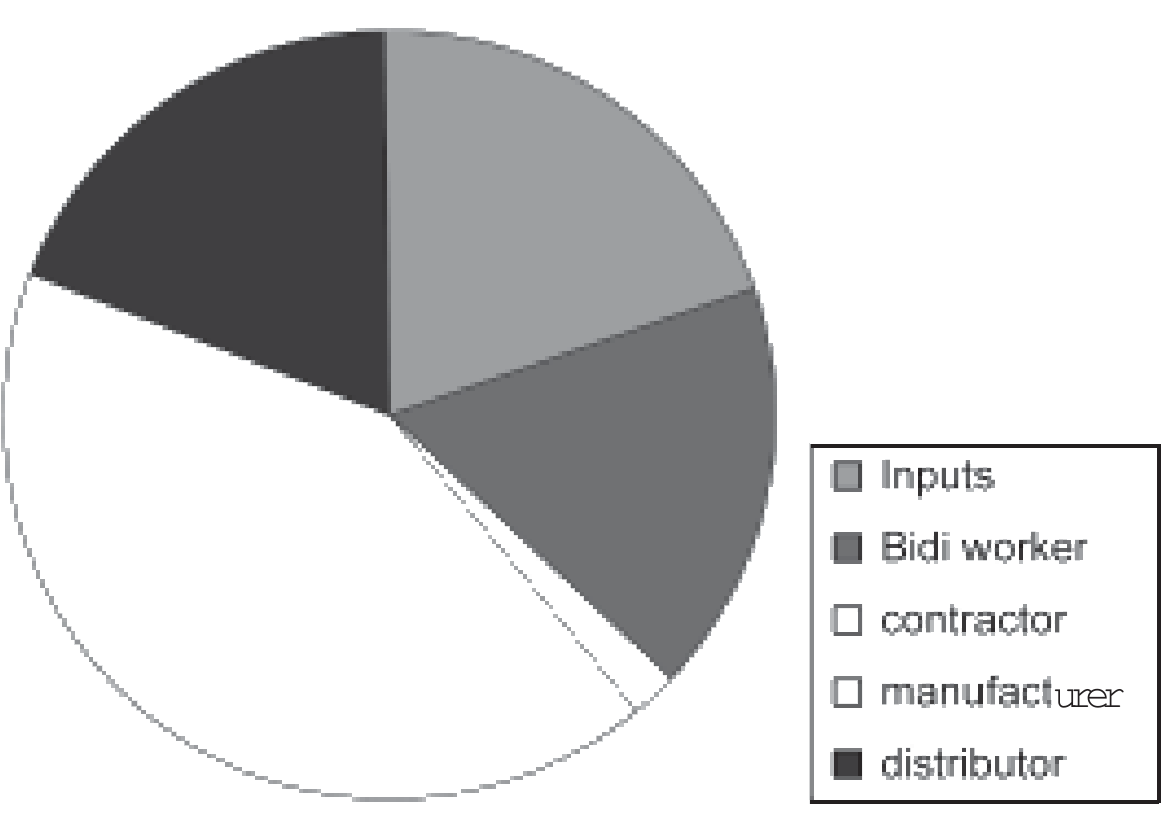
Arrange the following groups in an ascending order in terms of their percentage share in the Bidi industry:
A. Manufacturer
B. Worker
C. Contractor
D. Distributor
Choose the correct answer from the options given below:
Answer & explanation
Correct answer: option 4
The correct answer is Option (4) → B, D, C, A
Note 1: The given answer is as per the official NTA Answer Key, which accepts both Option (2) and Option (4). However, as per the NCERT pie diagram of how the value of a finished bidi is distributed, none of the given options appears to be correct, as explained below.
(C) Contractor — the smallest share, only a thin sliver of the pie.
(B) Worker — a much larger slice than the contractor’s, though the bidi worker rolls every bidi by hand.
(D) Distributor — a slice close in size to the worker’s.
(A) Manufacturer — the largest share. The manufacturer gets the maximum amount because of the image of the brand, showing the power of images.
So the correct order begins with the contractor and ends with the manufacturer. Options (2) and (4), which NTA accepted, both begin with the worker, and no option begins with the contractor.
Note 2: The pie diagram on how the value of a finished bidi is distributed, in the section ‘Home-based Work’ of the chapter ‘Change and Development in Industrial Society’, was there in the pre-rationalised NCERT, which NTA followed in 2023. It has been deleted from the NCERT book (2025-26), though the chapter and its account of how bidis are made are still there.
NCERT (2025-26): “5.6 Home-based work … Let us look at the bidi industry. The process of making bidis starts in forested villages where villagers pluck tendu leaves and sell it to the forest department or a private contractor who in turn sells it to the forest department. On average a person can collect 100 bundles (of 50 leaves each) a day. The government then auctions the leaves to bidi factory owners who give it to the contractors. The contractor in turn supplies tobacco and leaves to home-based workers.…” NCERT (Pre-rationalised): “Let us see from the following pie diagram how the value of the finished bidi is distributed (Bhandari 2005: 410). The manufacturer gets the maximum amount, because of the image of the brand, showing the power of images.”
Pie diagram of how the value of the finished bidi is distributed, Section 5.6 Home-based Work (NCERT Pre-rationalised) |