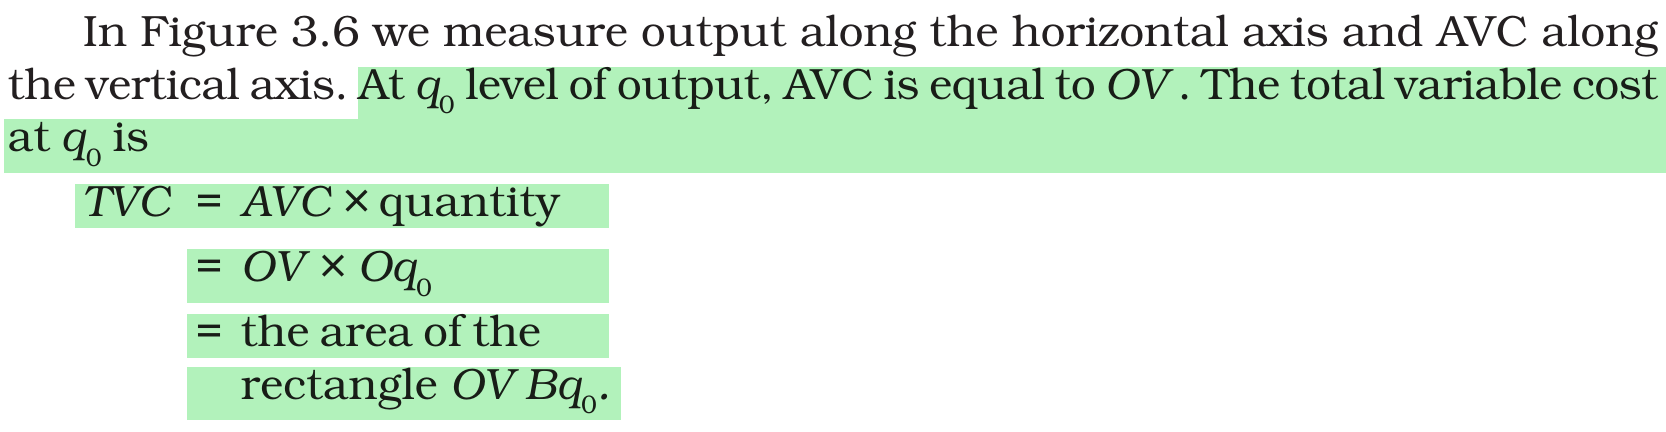
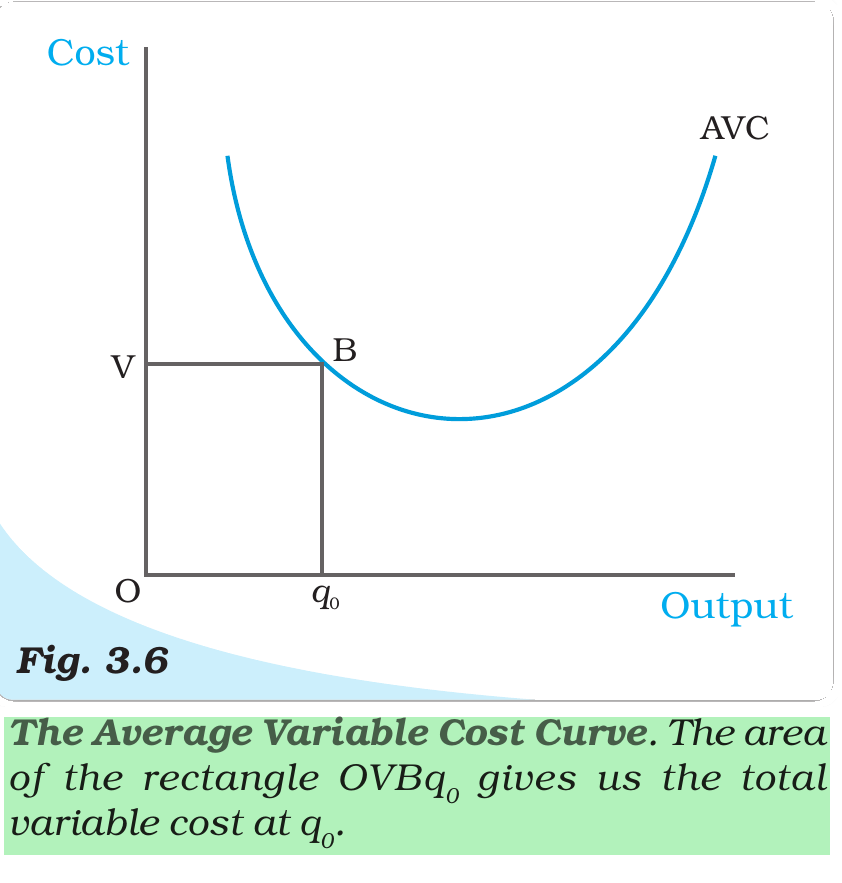
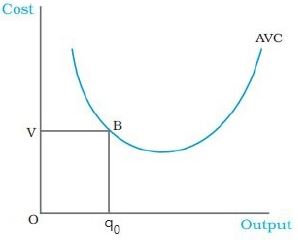
What does the rectangle OVBq0 depict in the given figure?
Answer & explanation
Correct answer: option 3
The correct answer is Option (3) → Total variable cost
The area of the rectangle OVBq0 gives the total variable cost at output q0.
The curve in the figure is the average variable cost (AVC) curve. At output q0, its height is OV, which is the variable cost per unit. The base of the rectangle, Oq0, is the number of units. So height × base = AVC × output = total variable cost. AVC is only the height OV, and total cost would also need the fixed cost.
NCERT (2026-27): Introductory Microeconomics — Chapter 3: Production and Costs
|