
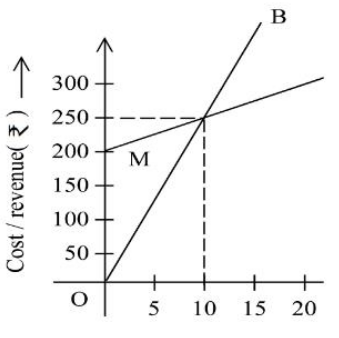
The following statements are made on the basis of given graph.
A. OB represents the cost function.
B. The line through M represents the cost function.
C. Loss occurs at x = 5.
D. Loss occurs at x = 15.
E. Profit occurs at x = 10.
Choose the correct answer from the options given below:
Answer & explanation
Correct answer: option 2
The correct answer is Option (2) → B and C only
The line OB starts at the origin: with no output there is no sales income, so OB is the revenue function. The line through M starts at M(0, 200): even at zero output there is a cost of Rs. 200 (the fixed cost), so this line is the cost function.
Both lines pass through (10, 250), the break-even point. Reading the lines:
Revenue: \(R(x) = 25x\) (through (0, 0) and (10, 250))
Cost: \(C(x) = 200+5x\) (through (0, 200) and (10, 250))
\(x = 5: \ R = 125, \ C = 225\), loss
\(x = 10: \ R = C = 250\), no profit, no loss
\(x = 15: \ R = 375, \ C = 275\), profit
So OB is revenue, the line through M is cost, there is a loss before x = 10, break-even at x = 10 and a profit after x = 10.
Checking the statements
(A) OB represents the cost function. — Incorrect. OB starts at 0, so it is the revenue function.
(B) The line through M represents the cost function. — Correct. It starts at the fixed cost 200.
(C) Loss occurs at x = 5. — Correct. At x = 5, cost 225 is more than revenue 125.
(D) Loss occurs at x = 15. — Incorrect. At x = 15, revenue 375 is more than cost 275: a profit.
(E) Profit occurs at x = 10. — Incorrect. At x = 10 revenue equals cost (250): break-even, no profit.