
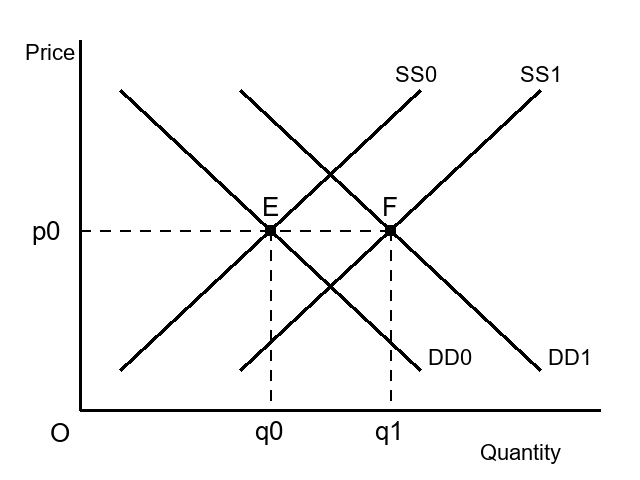
In the figure, the demand curve shifts from DD0 to DD1 and the supply curve shifts from SS0 to SS1. The equilibrium moves from E to F. What is the effect on the equilibrium?
Answer & explanation
Correct answer: option 2
The correct answer is Option (2) → The price remains unchanged and the quantity rises
Both curves shift right by the same amount. The new equilibrium F is at the same price p0 as E, but at a larger quantity, q1 instead of q0.
When both curves shift right, the quantity always rises. The price stays the same here because the two shifts are equal.
NCERT (2026-27): “Simultaneous Shifts of Demand and Supply … The impact on equilibrium price and quantity in all the four cases are given in Table 5.1. Each row of the table describes the direction in which the equilibrium price and quantity will change for each possible combination of the simultaneous shifts in demand and supply curves. For instance, from the second row of the table, we see that due to a rightward shift in both demand and supply curves, the equilibrium quantity increases invariably but the equilibrium price may either increase, decrease or remain unchanged. The actual direction in which the price will change will depend on the magnitude of the shifts. …” “Simultaneous Shifts of Demand and Supply … In the Figure 5.4(a), it can be seen that due to rightward shifts in both demand and supply curves, the equilibrium quantity increases whereas the equilibrium price remains unchanged, and in Figure 5.4(b), equilibrium quantity remains the same whereas price decreases due to a leftward shift in demand curve and a rightward shift in supply curve.” |