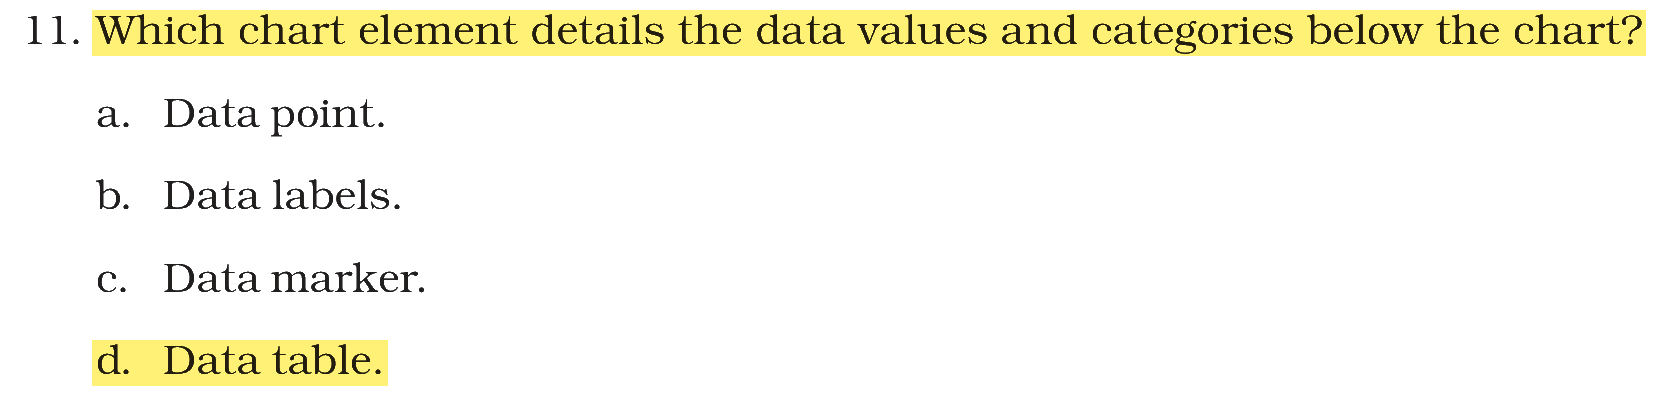
Which chart element gives details of the data values and also the categories below the chart?
Answer & explanation
Correct answer: option 2
The correct answer is Option (2) → Data table
In an Excel chart, a data table is a grid placed below the chart that lists the values of each data series against the categories of the horizontal axis.
Why the other options are incorrect
Option (1) Data labels — Incorrect. Data labels show values on the bars, points or slices themselves, not a list of values and categories below the chart.
Option (3) Data marker — Incorrect. A marker is the bar, dot or slice that stands for one value.
Option (4) Data point — Incorrect. A data point is a single value plotted in the chart.
Note: The NCERT book’s answer key prints “11. b” (Data labels) for this exercise question, but the element it describes, values and categories shown below the chart, is the data table; the key line is a misprint.
NCERT (2026-27 edition):
NCERT (2026-27 edition):
|