
CUETMOCK
  • Pricing
  • Mentors
Log inStart freeStart free mocks→

First test, then trust

Try a free CUET mock test.

Join 5,00,000+ students who rehearsed exam day on the exact NTA screen before sitting CUET. On the web and on Android.

Start free mocks →Get the Android app
CUETMOCK

India's #1 CUET Mock Test Platform. Original NCERT-based questions on the exact NTA exam screen — trusted by 5,00,000+ students since CUET 2022.

Get it onGoogle PlayScan to download the CUETMOCK app

Mock tests

  • CUET mock test series
  • Commerce mocks
  • Humanities (Arts) mocks
  • Science mocks
  • Languages & GAT mocks
  • Free practice questions
  • Pricing

Resources

  • CUET exam guide
  • CUET syllabus
  • Universities accepting CUET
  • Expert blogs
  • News & notifications
  • Webinars & counselling
  • CUET score calculator
  • How we estimate your rank
  • FAQs

Company

  • About us
  • Our leadership & team
  • Our toppers
  • Mentors
  • For schools
  • Contact us
  • Terms
  • Privacy
  • Refund policy

Talk to us

+91 7696 6630 56info@cuetmock.comWhatsApp us

Our other platforms

  • JEE Mock — For IIT-JEE aspirants
  • NEET Mock — For NEET aspirants

Newsletter

Exam updates, study material and offers — no spam.

© 2026 NYC Ventures Pvt. Ltd.

701-702, Royal Business Park, Zirakpur, Punjab - 140603

  • Terms of use
  • Privacy policy
  • Refund policy
  • Contact us

iCUETMOCK is an independent preparation platform, not affiliated with the National Testing Agency (NTA). Always check exam details on the official NTA website.

  • Home
  • Mock tests
  • CUET guide
  • Pricing
  • Log in
Home/Practice questions/Biology
BiologyBiodiversity and Conservation

Alexander von Humboldt observed the relationship shown in the graph b…

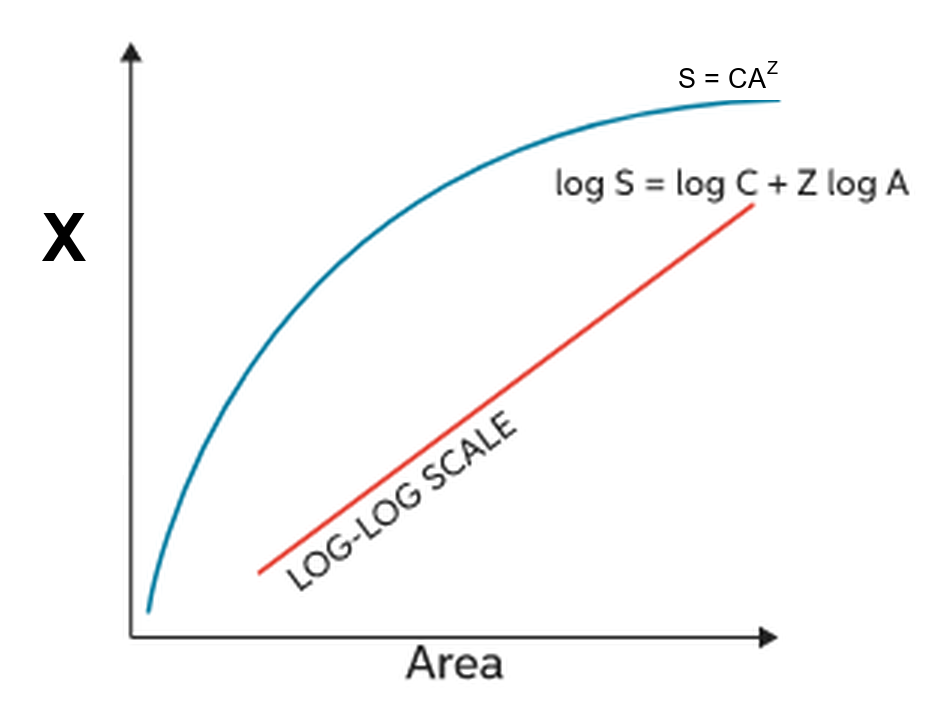
Alexander von Humboldt observed the relationship shown in the graph below. Identify X in the graph.
Answer & explanation+

Correct answer: option 4

The correct answer is Option (4) → Species richness

Alexander von Humboldt explored the South American jungles. He saw that within a region, species richness increased with increasing explored area, but only up to a limit. For many groups of organisms the curve is a rectangular hyperbola, given by S = CAZ. On a logarithmic scale it becomes a straight line, log S = log C + Z log A, where S is species richness and A is area. The quantity on the y-axis is therefore species richness.

Option (1) Frugivorous (fruit-eating) birds — Incorrect. Frugivorous (fruit-eating) birds are a group of animals, not a quantity on an axis. The book uses them only as an example of very large areas (whole continents), where the slope of the line is steep.

Option (2) Biomass — Incorrect. Biomass is the mass of living matter. The species-area graph counts the number of species, not their mass.

Option (3) Extinction — Incorrect. Extinction is the loss of species. Humboldt’s graph shows how many species are found as area increases, not how many are lost.

Option (4) Species richness — Correct. In both the curve and the log line, S stands for species richness, and it is plotted against area.

Note: Half this question lives inside a graph. Give NCERT figures and their labels the same attention as the text, because NTA happily lifts questions straight off a curve.

NCERT Extract:
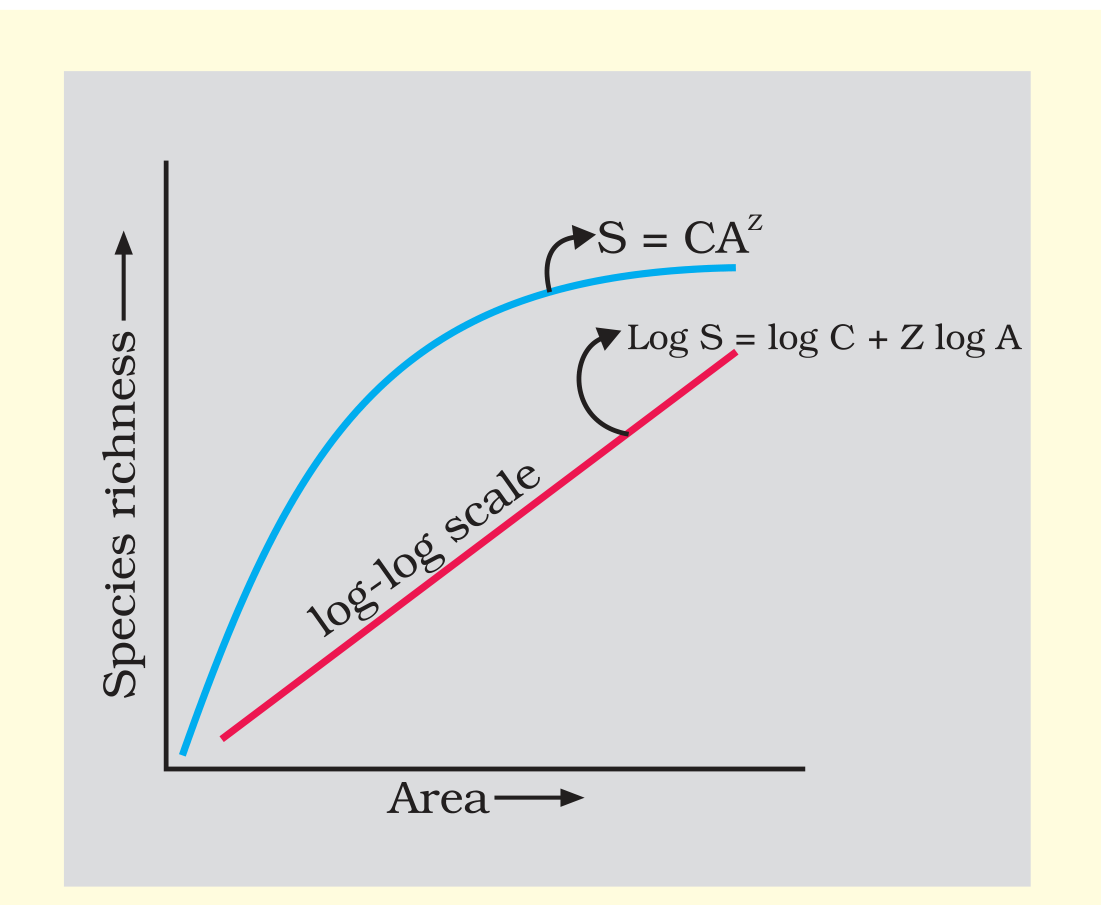
Patterns of Biodiversity – “… (ii) Species-Area relationships : During his pioneering and extensive explorations in the wilderness of South American jungles, the great German naturalist and geographer Alexander von Humboldt observed that within a region species richness increased with increasing explored area, but only up to a limit. In fact, the relation between species richness and area for a wide variety of taxa (angiosperm plants, birds, bats, freshwater fishes) turns out to be a rectangular hyperbola (Figure 13.2). On a logarithmic scale, the relationship is a straight line described by the equation
log S = log C + Z log A
where
S = Species richness A = Area
Z = slope of the line (regression coefficient)
C = Y-intercept”
Textbook figure

Figure 13.2 Showing species area relationship. Note that on log scale the relationship becomes linear

Advertisement

Practise more on Biodiversity and Conservation

Chapter-wise mocks on the real NTA exam screen, with solutions and your rank. Your first mocks are free.

Start free mocks →

Advertisement

Next questions

  1. Arjun suffers from panic attacks. His therapist teaches him relaxation procedures, gently disputes his negative thoughts, gives him behavio…Psychology · Therapeutic Approaches
  2. Which of the following best describes the tone of the poem?English · Comprehension - (Poetry / Literary)
  3. Which set of reagents will be most suitable to bring about the following change? 2,4,6-Trinitrochlorobenzene to picric acidChemistry · Organic: Alcohols, Phenols and Ethers
  4. If the length of a rectangle is increased by 20% and its breadth is decreased by 15%, what happens to its area?General Aptitude Test · Quantitative Reasoning
  5. A negative charge, released from rest in an electric field, moves towards a point ofPhysics · Electrostatic Potential and Capacitance
  6. 'The business of a partnership concern may be carried on by all the partners or any of them acting for all.' Which feature of partnership i…Accountancy Part A · Accounting for Partnership
  7. Formaldehyde undergoes Cannizzaro reaction because(A) It has alpha-hydrogen atom.(B) It does not have alpha-hydrogen atom.(C) It does not u…Chemistry · Organic: Aldehydes, Ketones and Carboxylic Acids
  8. The solution set of the inequality 3x + 5y lt 15 is:Maths. Section A · Linear Programming (Section A)
  9. In LCR series circuit with resistance R, inductive reactance X_L and capacitive reactance X_C , the maximum current ‘ I_0 ’ at resonance is…Physics · Alternating Current
  10. At high doses, _______kills cancer cells or slows their growth by damaging their DNA. Cancer cells whose DNA is damaged beyond repair stop…General Aptitude Test · General Knowledge