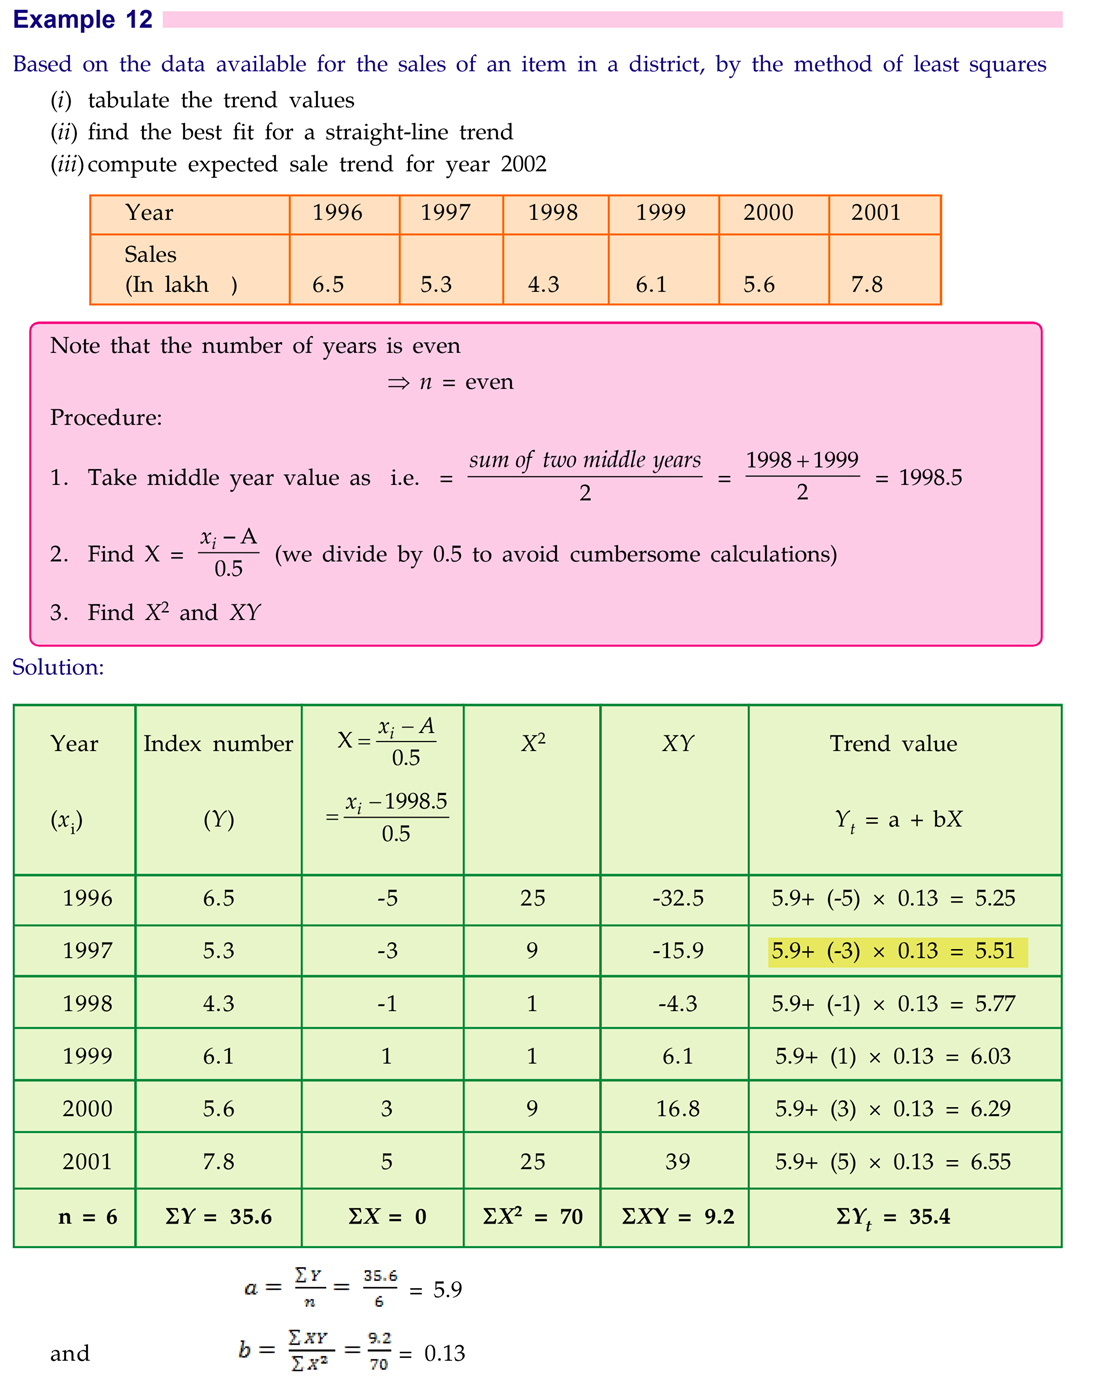
Consider the following data:
| Year | 1995 | 1996 | 1997 | 1998 | 1999 | 2000 | 2001 | 2002 |
| Sales (in crores) | 6.7 | 5.3 | 4.3 | 6.1 | 5.6 | 7.9 | 5.8 | 6.1 |
By using the method of least squares, the trend value for 1997 is:
Answer & explanation
Correct answer: option 3
The correct answer is Option (3) → 5.82
There are 8 years (an even number), so the middle falls between 1998 and 1999. Let
\( \displaystyle u=2(t-1998.5) \)
so the years 1995 to 2002 give u = −7, −5, −3, −1, 1, 3, 5, 7, and \( \Sigma u=0 \).
The least squares trend line is \( y=a+bu \), with \( a=\frac{\Sigma y}{n} \) and \( b=\frac{\Sigma uy}{\Sigma u^2} \).
\( \displaystyle \Sigma y=6.7+5.3+4.3+6.1+5.6+7.9+5.8+6.1=47.8 \)
\( \displaystyle a=\frac{47.8}{8}=5.975 \)
\( \displaystyle \Sigma uy=-7(6.7)-5(5.3)-3(4.3)-1(6.1)+1(5.6)+3(7.9)+5(5.8)+7(6.1) \)
\( \displaystyle =-46.9-26.5-12.9-6.1+5.6+23.7+29.0+42.7 \)
\( \displaystyle =8.6 \)
\( \displaystyle \Sigma u^2=49+25+9+1+1+9+25+49=168 \)
\( \displaystyle b=\frac{8.6}{168}\approx 0.0512 \)
For 1997, u = 2(1997 − 1998.5) = −3:
\( \displaystyle y=5.975+0.0512\times(-3) \)
\( \displaystyle =5.975-0.154 \)
\( \displaystyle \approx 5.82 \)
CBSE Applied Mathematics (Class XII):
Computation of Straight-Line Trend by Using Method of Least Squares