
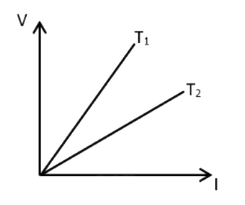
The voltage (V) versus current (I) graphs for a conductor at two different temperatures are shown in the figure. The relation between T1 and T2 is:
Answer & explanation
Correct answer: option 1
The correct answer is Option (1) → T1 > T2
The slope of a V-I graph is V/I, which is the resistance of the conductor. From the figure, the line for T1 is steeper than the line for T2.
\( \displaystyle R_1 \gt R_2 \)
For a metallic conductor the resistance increases with temperature, because the ions vibrate more strongly and the electrons collide with them more often.
\( \displaystyle R_T = R_0\left[1 + \alpha(T - T_0)\right] \)
So the larger resistance belongs to the higher temperature: \( T_1 \gt T_2 \).
NCERT (2026-27):
Temperature Dependence of Resistivity – “… Over a limited range of temperatures, that is not too large, the resistivity of a metallic conductor is approximately given by,
\( \displaystyle \rho_T = \rho_0\left[1 + \alpha\left(T - T_0\right)\right] \qquad (3.26) \)
where \( \rho_T \) is the resistivity at a temperature T and \( \rho_0 \) is the same at a reference temperature \( T_0 \). … For metals, \( \alpha \) is positive.”