CUET Preparation Today
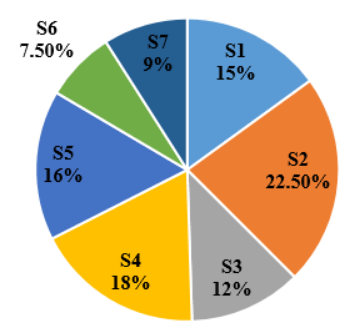
The following pie chart shows the number of cups sold by each of 7 different shops during a given period of time as percentages of the total number of cups sold by these 7 shops taken together during the above-mentioned time period.
If the number of cups sold by S6 during this period is 165, then how many cups in total are sold during this period by all these 7 shops taken together? |
2400 2000 2600 2200 |
2200 |
Number of cups sold by S6 = 7.50% of total number of cups sold ATQ, 7.50% of total number of cups sold = 165 Total number of cups sold = \(\frac{100}{7.50}\) × 165 = 2200 |