CUET Preparation Today
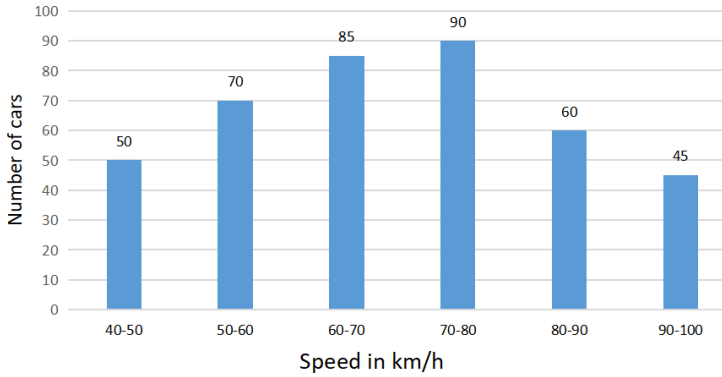
The given histogram shows the frequency distribution of the speed of cars passing through a particular spot on a highway. Read the graph and answer the following question.
What percentage of cars were running with the speed of 90km/h and above ? |
15.75% 11.25% 10% 21.25% |
11.25% |
Number of cars running with speed 90 km/h and above = 45 Total number of cars = 50 + 70 + 85 + 90 + 60 + 45 = 400 Required percentage = \(\frac{45}{400}\) × 100 = 11.25% |