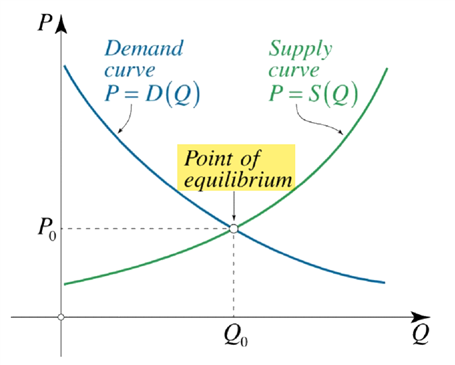
In the below mentioned demand supply curve, identify the equilibrium point
Answer & explanation
Correct answer: option 3
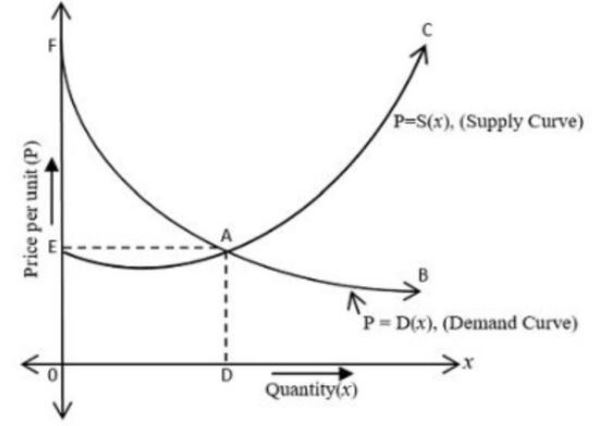
The correct answer is Option (3) → A
The market equilibrium is where the quantity demanded equals the quantity supplied at the same price, that is where the demand curve and the supply curve intersect.
In the figure, the two curves meet at A. Its projections give the equilibrium price E on the price axis and the equilibrium quantity D on the quantity axis.
C and B are only end points of the supply and demand curves, and F is where the demand curve meets the price axis.
CBSE Applied Mathematics (Class XII):
Equilibrium Price and Quantity