CUET Preparation Today
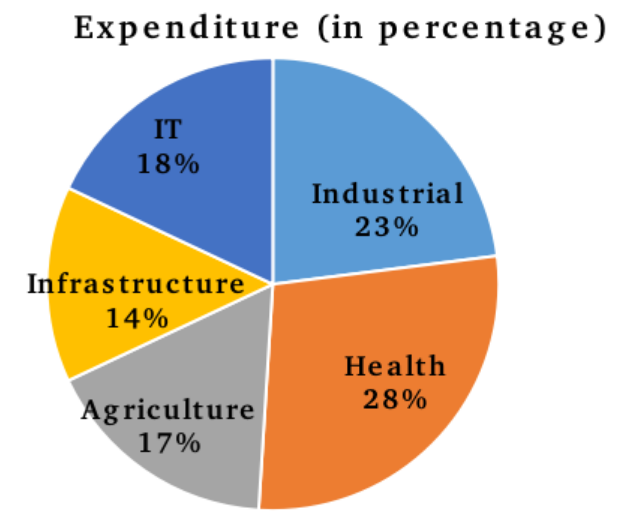
The following pie chart shows the expenditure of a village in a given year in the different sectors of its economy.
If the amount spent on agriculture was ₹8.5 crore, then find the amount spent in the IT sector. |
₹7.5 crore ₹10.5 crore ₹8 crore ₹9 crore |
₹9 crore |
Amount spent on agriculture = 8.5 crores & Amount spent on agriculture = 17% of total expenditure ATQ , 17% of total expenditure = 8.5 crores Total expenditure = \(\frac{100 }{17}\) × 8.5 = 50 crore Amount spent in the IT sector = \(\frac{18 }{100}\) × 50 = 9 crore
|