
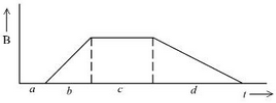
The graph gives the variation of magnitude of magnetic field (B) that exists throughout a conducting loop, with direction of the field perpendicular to the plane of the loop. The regions of graph according to magnitude of emf induced in decreasing order is:
Answer & explanation
Correct answer: option 4
The correct answer is Option (4) → \( b\gt d\gt c=a \)
By Faraday’s law the induced emf is the rate of change of flux. The loop and its area A are fixed and the field is perpendicular to it, so \( \Phi = BA \) and the magnitude of the emf is \( |\varepsilon| = A\left|\frac{dB}{dt}\right| \), proportional to the slope of the B–t graph.
Reading the slope in each region:
Region a: B = 0, slope 0, so \( \varepsilon = 0 \)
Region b: B rises steeply, the largest slope
Region c: B is constant, slope 0, so \( \varepsilon = 0 \)
Region d: B falls by the same amount as it rose in b, but over a longer time, so a gentler slope
Since b and d change B by the same amount and b takes less time, the emf in b is larger than in d; a and c both give zero:
\( |\varepsilon_b|\gt|\varepsilon_d|\gt|\varepsilon_c| = |\varepsilon_a| = 0 \)