
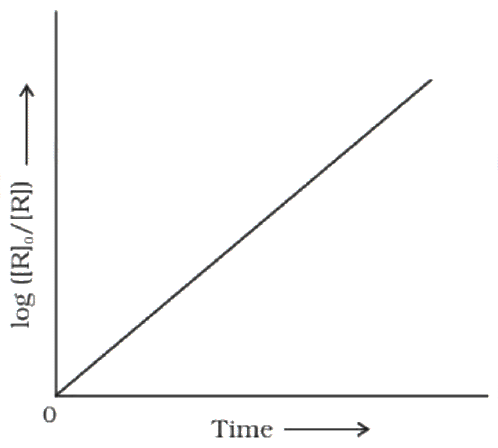
The figure given below represents the graph between \( \log\frac{[R]_0}{[R]} \) vs time, for a first order reaction. The slope of the graph is:
Answer & explanation
Correct answer: option 1
The correct answer is Option (1) → \( \frac{k}{2.303} \)
For a first order reaction, the integrated rate equation is:
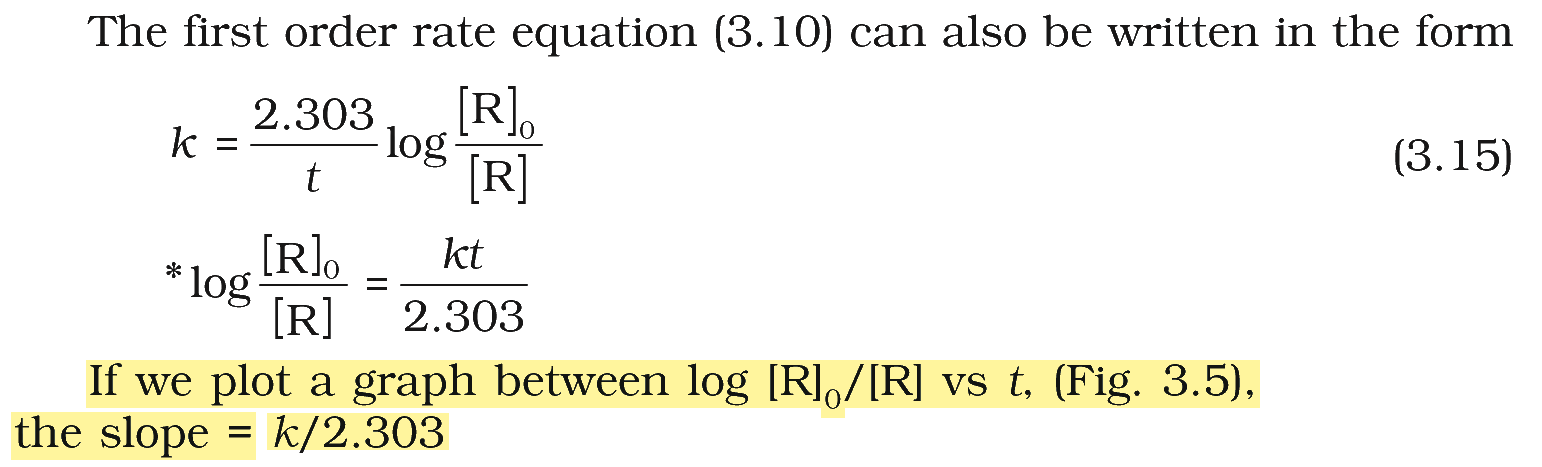
\( \displaystyle k=\frac{2.303}{t}\log\frac{[R]_0}{[R]} \)
Rearranging it to show the dependence on time:
\( \displaystyle \log\frac{[R]_0}{[R]}=\frac{k}{2.303}\,t \)
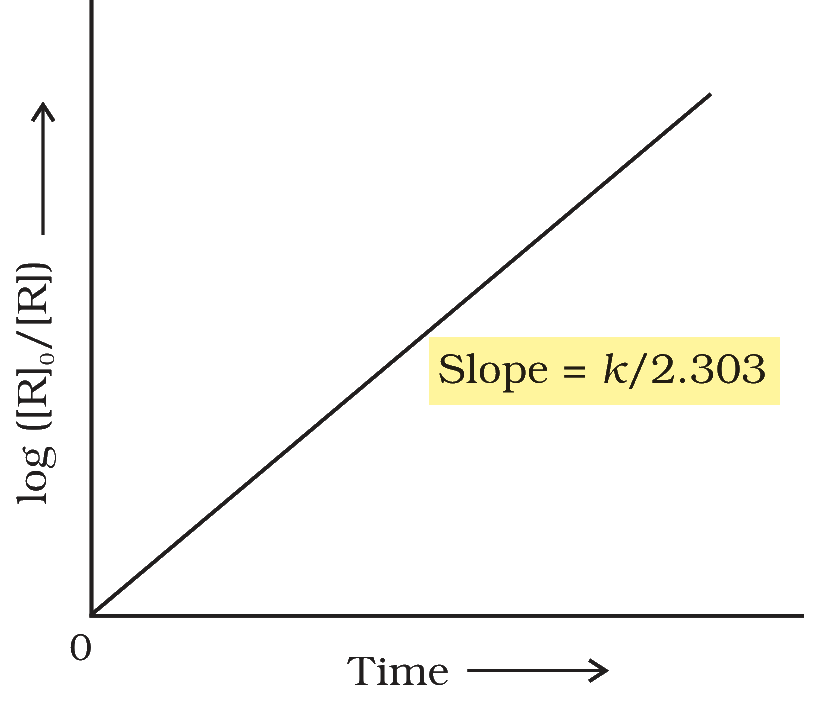
This has the form y = mx, a straight line through the origin. With log([R]0/[R]) on the y-axis and time on the x-axis, the slope is k/2.303. The slope is positive, as the rising line in the figure shows.
Why the other options are incorrect
Option (2) \( \frac{-k}{2.303} \) — Incorrect. This is the slope of the plot of log [R] against time, since log [R] = −kt/2.303 + log [R]0. That line falls with time.
Option (3) \( \frac{-2.303}{k} \) — Incorrect. This is the negative reciprocal of the slope. It has the unit of time, while the slope has the unit of k (s−1).
Option (4) \( \frac{2.303}{k} \) — Incorrect. This is the reciprocal of the slope; it has the unit of time, while the slope has the unit of k.
NCERT (2026-27 edition):
First Order Reactions – …
Note: The same/similar question has been asked in different years by NTA as per the details given below:
| 2026 | 2025 | 2024 | 2023 | 2022 |
|---|---|---|---|---|
| 26-05 S1 19-05 S1 | – | – | – | – |