CUET Preparation Today
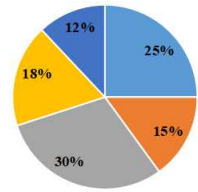
Study the following pie-chart carefully, which shows a state government's expenditure (% allocation) on various sectors during the year 2019. If ₹27 million were spent on transport in 2019, what would have been the total expenses (in million) of the given state government in that year considering mentioned sectors only?
|
160 140 150 130 |
150 |