CUET Preparation Today
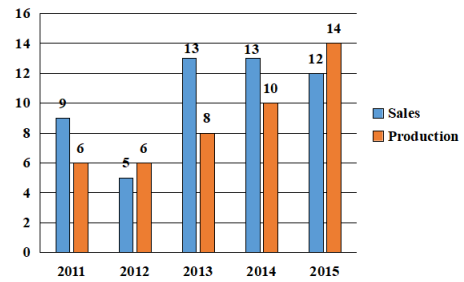
Study the given bar-chart and answer the question that follows. The bar chart shows the production and sale of cars (in thousands) over the years 2011 to 2015.
The percentage by which sales exceeds production in 2014 is: |
35 25 20 30 |
30 |
⇒ Percentage of sales more than production in 2014 = \(\frac{13-10 }{10}\) × 100 = 30% |