CUET Preparation Today
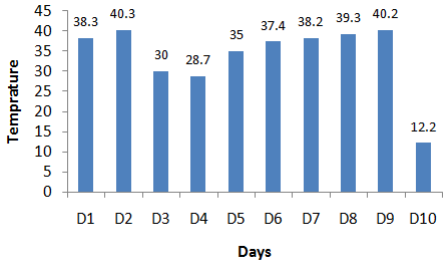
The Bar graph given below presents the maximum temperature (in °C) of a city for 10 different days spread over several months.
The temprature on D5 is how much percentage more than the temprature on D3? |
23.01% 21.07% 24.57% 16.67% |
16.67% |
The temperature on D5 = 35 Temperature on D3 = 30 Required percentage = \(\frac{35 - 30 }{30}\) × 100 = \(\frac{5 }{30}\) × 100 = 16.67% |