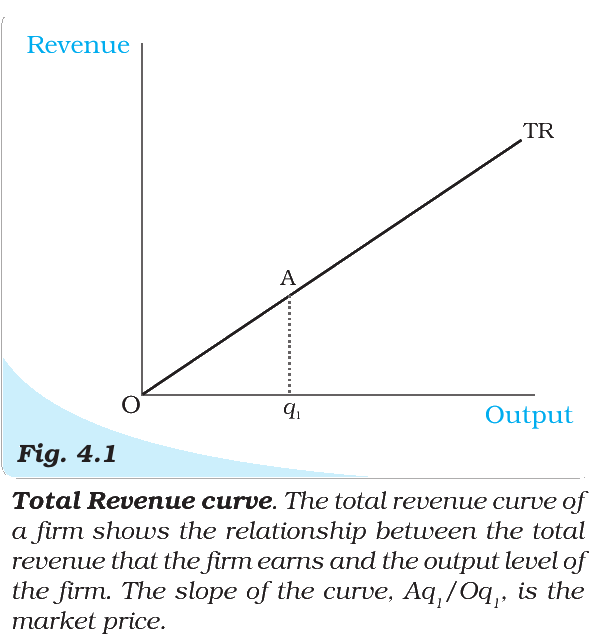
The slope of the curve in the given diagram (Aq1/Oq1) represents which of the following?
Answer & explanation
Correct answer: option 3
The correct answer is Option (3) → Market Price
The curve is the total revenue curve. At one unit of output (Oq1), TR is p × 1 = p (the height Aq1). So the slope Aq1/Oq1 = p, the market price. At any output q, the height of the line is TR = p × q, so height divided by output is again p.
The slope of the TR curve is also the extra revenue from one more unit. For a price-taking firm that is the market price as well.
NCERT (2026-27): “4.2 Revenue … Second, the total revenue increases as the output goes up. Moreover, the equation ‘TR = p × q’ is that of a straight line because p is constant. This means that the TR curve is an upward rising straight line. Third, consider the slope of this straight line. When the output is one unit (horizontal distance Oq1 in Figure 4.1), the total revenue (vertical height Aq1 in Figure 4.1) is p × 1 = p. Therefore, the slope of the straight line is Aq1/Oq1 = p.”
|