
CUETMOCK
  • Pricing
  • Mentors
Log inStart freeStart free mocks→

First test, then trust

Try a free CUET mock test.

Join 5,00,000+ students who rehearsed exam day on the exact NTA screen before sitting CUET. On the web and on Android.

Start free mocks →Get the Android app
CUETMOCK

India's #1 CUET Mock Test Platform. Original NCERT-based questions on the exact NTA exam screen — trusted by 5,00,000+ students since CUET 2022.

Get it onGoogle PlayScan to download the CUETMOCK app

Mock tests

  • CUET mock test series
  • Commerce mocks
  • Humanities (Arts) mocks
  • Science mocks
  • Languages & GAT mocks
  • Free practice questions
  • Pricing

Resources

  • CUET exam guide
  • CUET syllabus
  • Universities accepting CUET
  • Expert blogs
  • News & notifications
  • Webinars & counselling
  • CUET score calculator
  • How we estimate your rank
  • FAQs

Company

  • About us
  • Our leadership & team
  • Our toppers
  • Mentors
  • For schools
  • Contact us
  • Terms
  • Privacy
  • Refund policy

Talk to us

+91 7696 6630 56info@cuetmock.comWhatsApp us

Our other platforms

  • JEE Mock — For IIT-JEE aspirants
  • NEET Mock — For NEET aspirants

Newsletter

Exam updates, study material and offers — no spam.

© 2026 NYC Ventures Pvt. Ltd.

701-702, Royal Business Park, Zirakpur, Punjab - 140603

  • Terms of use
  • Privacy policy
  • Refund policy
  • Contact us

iCUETMOCK is an independent preparation platform, not affiliated with the National Testing Agency (NTA). Always check exam details on the official NTA website.

  • Home
  • Mock tests
  • CUET guide
  • Pricing
  • Log in
Home/Practice questions/Biology
BiologyBiodiversity and Conservation

Given below are two statements: one is labelled as Assertion (A) and…

Given below are two statements: one is labelled as Assertion (A) and the other is labelled as Reason (R).

Assertion (A): If the species-area relationships among very large areas, like entire continents, are analysed, the slope of the line is much steeper.

Reason (R): On a logarithmic scale, the relationship between species richness and area is a straight line.

In the light of the above statements, choose the correct answer from the options given below:

Answer & explanation+

Correct answer: option 2

The correct answer is Option (2) → Both (A) and (R) are true but (R) is NOT the correct explanation of (A)

Assertion (A): If the species-area relationships among very large areas, like entire continents, are analysed, the slope of the line is much steeper. — True. A is about the value of the slope (Z). For most regions Z lies between 0.1 and 0.2. When very large areas such as whole continents are compared, the slope is much steeper, with Z between 0.6 and 1.2.

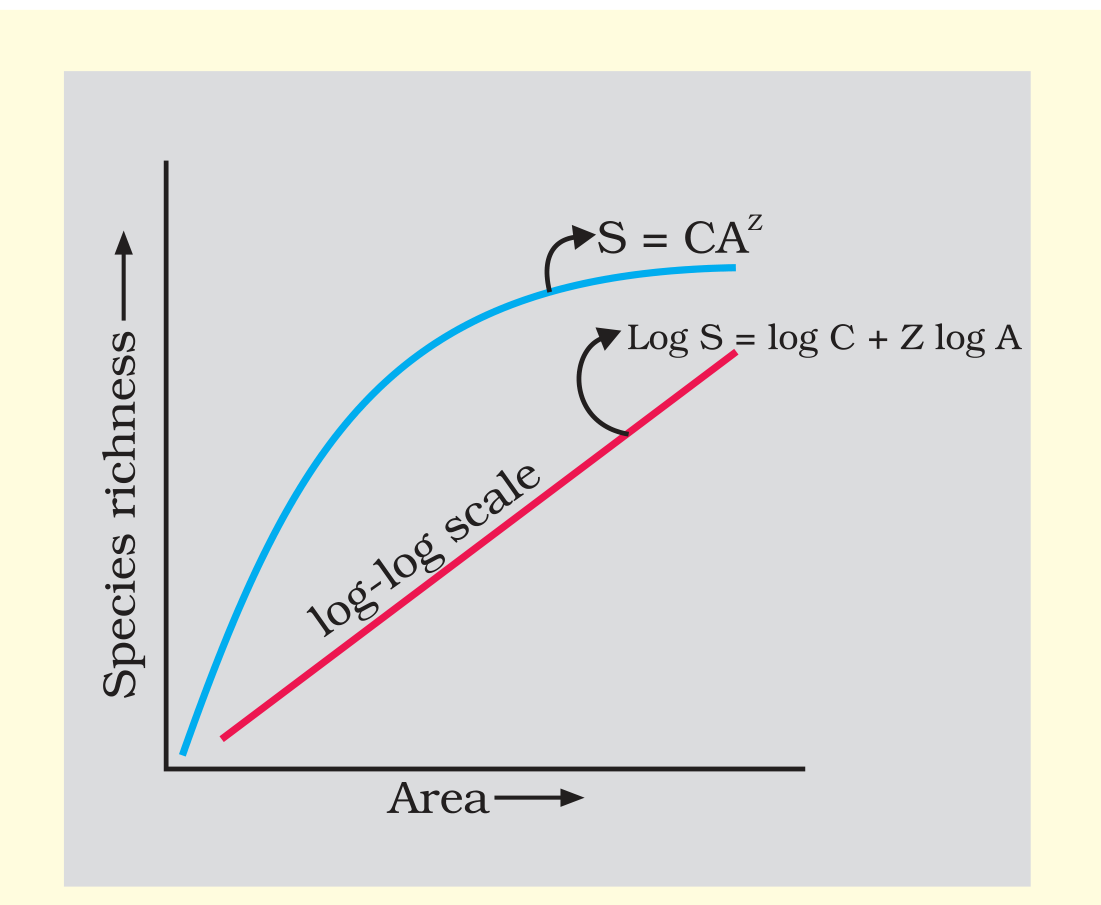
Reason (R): On a logarithmic scale, the relationship between species richness and area is a straight line. — True. R is about the shape of the graph. Species richness plotted against area gives a rectangular hyperbola. On a logarithmic scale the same relationship becomes a straight line, log S = log C + Z log A, in which Z is the slope.

Why R does not explain A? R tells us only that the relationship is a straight line on a log scale. That holds for every region, small or large. A is about how steep that line is for continents. A straight line can be steep or gentle, so the fact that it is straight cannot tell us why the slope is higher for continents. So both statements are correct, but R is not the explanation of A.

NCERT Extract:
Patterns of Biodiversity – “… In fact, the relation between species richness and area for a wide variety of taxa (angiosperm plants, birds, bats, freshwater fishes) turns out to be a rectangular hyperbola (Figure 13.2). On a logarithmic scale, the relationship is a straight line described by the equation
log S = log C + Z log A
where
S = Species richness
A = Area
Z = slope of the line (regression coefficient)
C = Y-intercept”
Patterns of Biodiversity – “… But, if you analyse the species-area relationships among very large areas like the entire continents, you will find that the slope of the line to be much steeper (Z values in the range of 0.6 to 1.2). For example, for frugivorous (fruit-eating) birds and mammals in the tropical forests of different continents, the slope is found to be 1.15.”
Textbook figure

Figure 13.2 Showing species area relationship. Note that on log scale the relationship becomes linear

Advertisement

Practise more on Biodiversity and Conservation

Chapter-wise mocks on the real NTA exam screen, with solutions and your rank. Your first mocks are free.

Start free mocks →

Advertisement

Next questions

  1. "General Theory of Employment, Interest and Money" by John Maynard Keynes was written in?Economics · Macro Economics: Introduction
  2. The perimeter of an equilateral triangle is equal to circumference of a circle. The ratio of their areas is:General Aptitude Test · Quantitative Reasoning
  3. Which of the following is the largest brackish lake of India?General Aptitude Test · General Knowledge
  4. Which of the following is commutative for rational numbers?General Aptitude Test · Quantitative Reasoning
  5. Let [.] denote the greatest integer function, then the value of ∫limits_0^1.5 x≤ft[x^2] d x, isMaths. Section A · Definite Integration
  6. If the wheel of a tricycle rotates 200 times in 44 km, what is its radius?General Aptitude Test · Quantitative Reasoning
  7. If A = […] , then A^TA^-1 isMaths. Section B1 · Determinants
  8. What is the full form of WWTP?General Aptitude Test · General Knowledge
  9. निम्न में से कौन-सा शब्द तद्भव है:Hindi · व्याकरण - सशब्द विचार
  10. What is the full form of the UPA?Political Science · Politics in India Since Independence: Recent Developments in Indian Politics