CUET Preparation Today
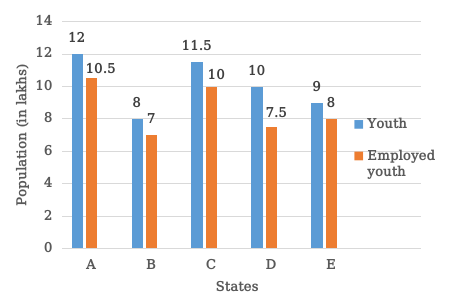
The following bar graph shows the number of youth (in lakhs) and the number of employed youth (in lakhs) in 5 states A, B, C, D and E. In which state(s) is the number of youth more than the average number of youth in the five states?
|
A A, C A, C, D, E A, C, D |
A, C |
Average number of youth in 5 state = \(\frac{12 + 11.5 + 8 + 10 + 9}{5}\) = \(\frac{50.5}{5}\) = 10.1 In state A & C number of youths are 12 & 10.5 respectively which are more than 10.1 |