CUET Preparation Today
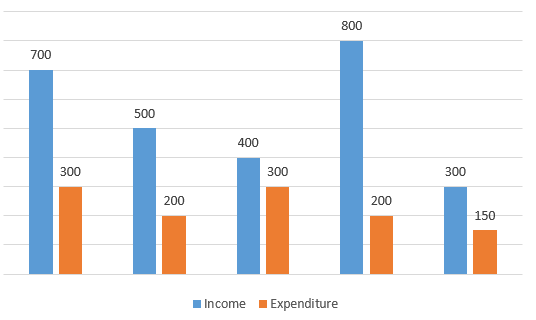
The bar graph given below shows the income and expenditure of a company in five years
Saving = Income - Expenditure In which of the year savings are minimum ? |
Y5 Y4 Y3 Y2 |
Y3 |
saving of Y5 = 300 - 150 = 150 Saving of Y4 = 800 - 200 = 600 Saving of Y3 = 400 - 300 = 100 Saving of Y2 = 500 - 200 = 300 So , saving is minimum for Y3 |