CUET Preparation Today
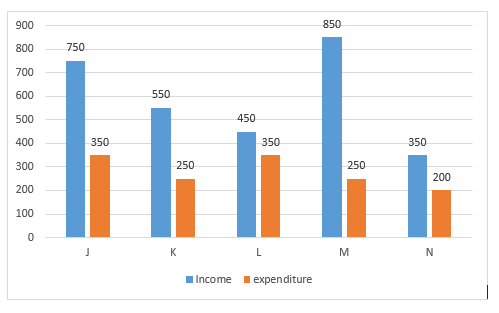
The bar graph given below shows the income and expenditure of a company in five years.
What is the ratio of total income in year M and N to the total expenditure in year J, K and L ? |
19 : 24 19 : 25 24 : 19 21 : 17 |
24 : 19 |
Total income in M & N : Total Expenditure in J , K & L ( 850 + 350 ) : ( 350 + 250 + 350 ) 1200 : 950 24 : 19 |