
The graph correctly representing the variation of image distance 'v' for a convex lens of focal length 'f' versus object distance 'u' is ____________________.
Fill in the blank with the correct answer from the options given below.
Answer & explanation
Correct answer: option 2
The correct answer is Option (2)
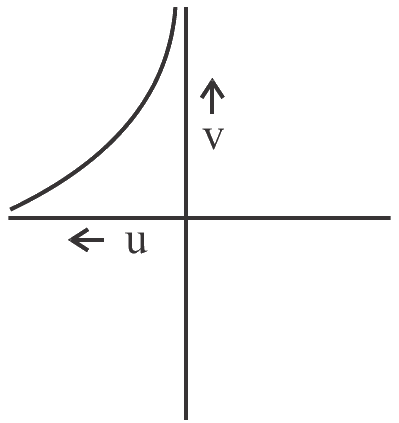
Use the lens formula with the Cartesian sign convention (distances measured from the optical centre, positive in the direction of the incident light). A real object is placed in front of the lens, so \( u \) is negative, and for a convex lens \( f \) is positive.
\( \displaystyle \frac{1}{v} - \frac{1}{u} = \frac{1}{f} \;\Rightarrow\; v = \frac{u f}{u + f} \)
For an object beyond the focus (\( u \lt -f \)):
\( u \to -\infty: v \to f \)
\( u \to -f: v \to +\infty \)
So the image distance is positive and increases as the object comes closer to the lens: starting from \( f \) for a very distant object, it rises more and more steeply as the object approaches the focus. The curve lies in the region of negative \( u \) and positive \( v \) and bends upwards, which is graph (2).