CUET Preparation Today
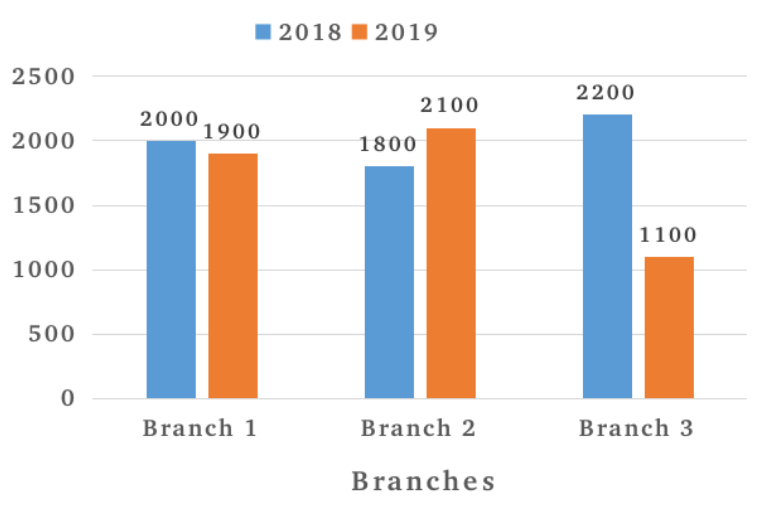
The following bar graph shows the sales of two wheelers from three different branches of a company during two consecutive years 2018 and 2019.
What is the average sale of all the branches in the year 2019? |
1900 2000 1500 1700 |
1700 |
Average sale of all branches in 2019 = \(\frac{1900+2100+1100 }{3}\) = \(\frac{5100 }{3}\) = 1700 |