CUET Preparation Today
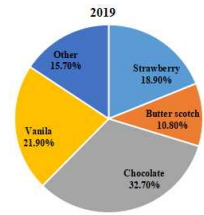
Study the given pie chart and answer the question that follows. The pie chart represents the popularity of ice-cream flavours among families in the year 2019.
In 2019, if 20% of the ‘Other’ category was Anjeer flavour and 4082 people preferred Anjeer flavour, then how many people were surveyed? |
1,25,000 1,50,000 1,40,000 1,30,000 |
1,30,000 |
20% of other category ice-cream = 4082 Total number of other category ice-cream = \(\frac{4082 }{20}\) × 100 = 20410 Number of other category ice-cream = 15.70% of total number of ice-cream ATQ, 15.70% of total number of ice-cream = 20410 Total number of ice-cream = \(\frac{20410 }{15.70}\) × 100 = 1,30,000 |