CUET Preparation Today
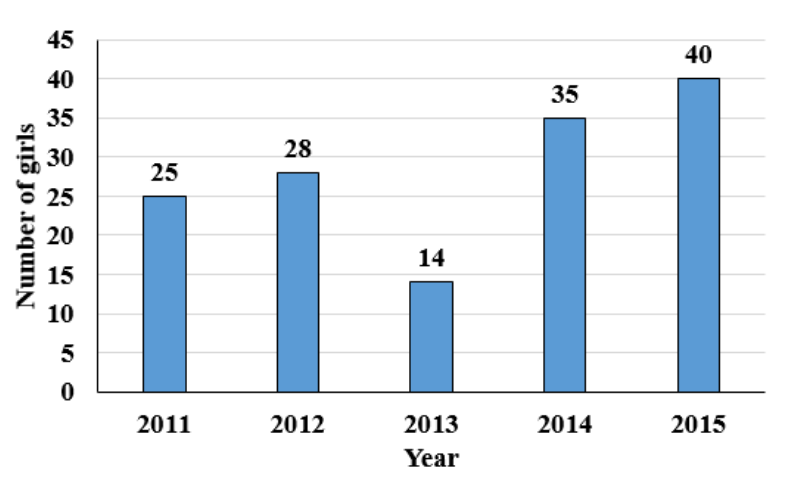
The following bar graph shows the number of girls in a school over 5 years.
Find the percentage decrease in the number of girls from the year 2012 to the year 2013 . |
50% 40% 20% 30% |
50% |
Percentage decrease in number of girls from 2012 to 2013 = \(\frac{28-14}{28}\) × 100 = 50% |