
According to the collision theory of reaction rates, an increase in temperature increases the rate of a reaction. This is because:
Answer & explanation
Correct answer: option 1
The correct answer is Option (1) → A greater number of molecules have energy equal to or greater than the threshold energy
By collision theory, only effective collisions form products: the molecules must collide with energy at least equal to the threshold energy and with proper orientation. The rate is written as:
\( \displaystyle \text{Rate}=Z_{AB}\,e^{-E_a/RT} \)
Here ZAB is the collision frequency and \( e^{-E_a/RT} \) is the fraction of molecules with energy equal to or greater than Ea. A rise in temperature increases this fraction sharply, so many more collisions become effective and the rate rises.
Why the other options are incorrect
Option (2) The reacting molecules move with greater velocity — Incorrect. Speed by itself does not decide the rate; what matters is that a larger fraction of molecules now has energy at or above the threshold energy.
Option (3) A greater number of collisions take place — Incorrect.
Not all collisions form products; only effective collisions do.
The rate nearly doubles for a 10° rise because the fraction of molecules with energy ≥ Ea doubles, not because the number of collisions doubles.
NCERT (2026-27 edition):
3.4 Temperature Dependence of the Rate of a Reaction – “Increasing the temperature of the substance increases the fraction of molecules, which collide with energies greater than Ea. It is clear from the diagram that in the curve at (t + 10), the area showing the fraction of molecules having energy equal to or greater than activation energy gets doubled leading to doubling the rate of a reaction.”
3.5 Collision Theory of Chemical Reactions – “… The collisions in which molecules collide with sufficient kinetic energy (called threshold energy) and proper orientation, so as to facilitate breaking of bonds between reacting species and formation of new bonds to form products are called as effective collisions.”
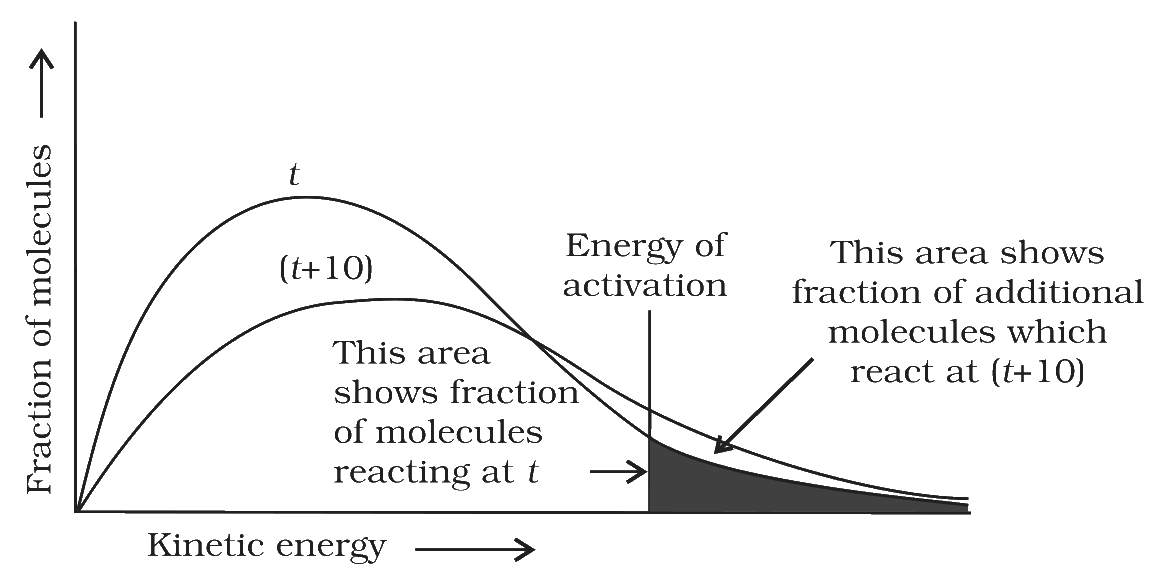
Fig. 3.9: Distribution curve showing temperature dependence of rate of a reaction