CUET Preparation Today
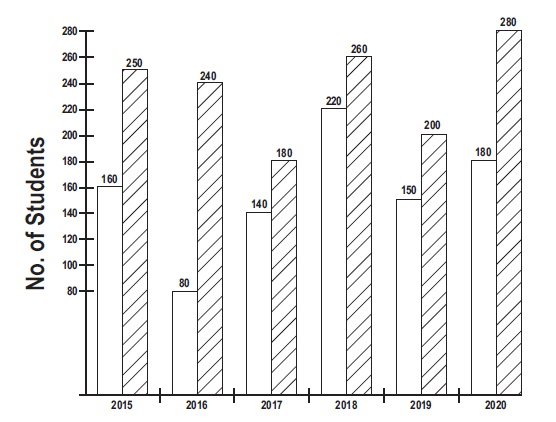
The following bar chart shows the no. of college students enrolled in two summer camps A and B from 2015 to 2020. Blank Bars = A Line Bars = B
Percentage increase in students enrollment in year 2021 is same as percentage increase in enrollment in year 2020 as compared to previous year in camp A. Find no. of student in camp A in 2021? |
180 236 216 316 |
216 |
No. of students in camp A in 2020 = 180 No. of students in camp A in 2019 = 150 Percentage increase = \(\frac{30}{150}\) × 100 = 20% Students in 2021 = 180 × \(\frac{120}{100}\) = 216 |