CUET Preparation Today
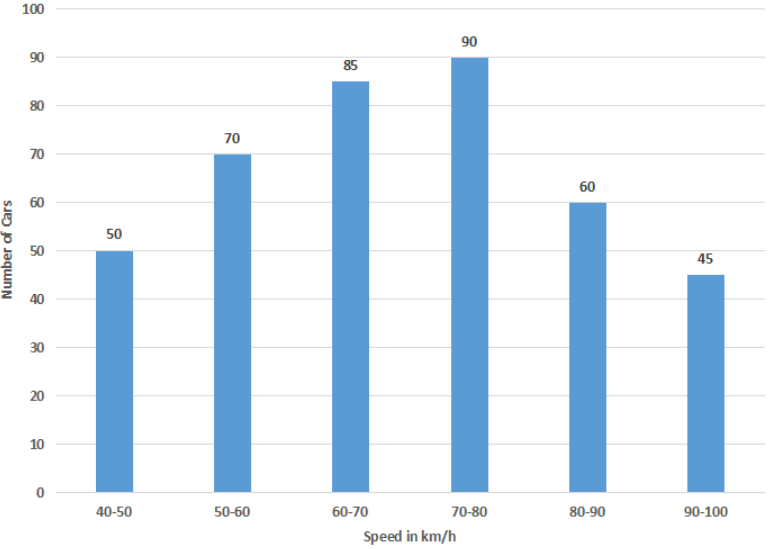
The given histogram shows the frequency distribution of the speed of cars passing though at a particular spot on a highway. Study the graph and answer the question that follows.
The number of cars with speed between 70 km/h and 80 km/his what percentage more than the number of the cars with speed between 50 km/h and 60 km/h? (correct to one decimal place) |
22.2% 15.5% 28.6% 29.7% |
28.6% |
Number of cars with speed b/w 70 & 80 km/h = 90 Number of cars with speed b/w 50 & 60 km/h = 70 Required percentage = \(\frac{90 - 70 }{70}\) × 100 = \(\frac{20 }{70}\) × 100 = 28.6% |