


CUET Preparation Today
The Bar graph given below presents the maximum temperature (in °C) of a city for 10 different days spread over several months.
|
27.1 26.1 28.0 28.1 |
28.1 |
Highest temperature = 40.3º Lowest temperature = 12.2º Difference b/w highest and lowest temperature = 40.3º - 12.2º = 28.1º |

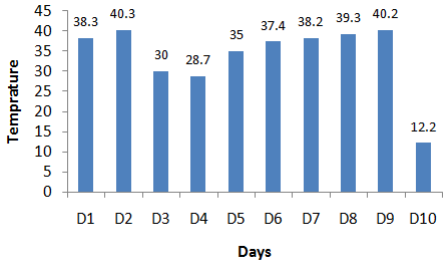 What is the difference (in degree Celsius) between the highest and the lowest recorded maximum temperatures from the data given for the ten days?